From Ars Technica · · 3m
Is solar's growth finally slowing in the US?
Solar power added less capacity in 2026 than the year before, marking a slowdown in the renewable energy boom.
In brief
Solar power added less capacity in 2026 than the year before, marking a slowdown in the renewable energy boom. Solar growth dropped from 48 to 39 terawatt-hours year-over-year, but renewables still met all new electricity demand. Originally reported by Ars Technica.
Electricity demand barely budging
US electricity use rose just 2 percent in the first seven months of 2026, down from 3 percent growth the year before. Data centers and electric vehicles are pushing demand up, but efficiency gains are holding it back.
Solar's explosive growth is cooling
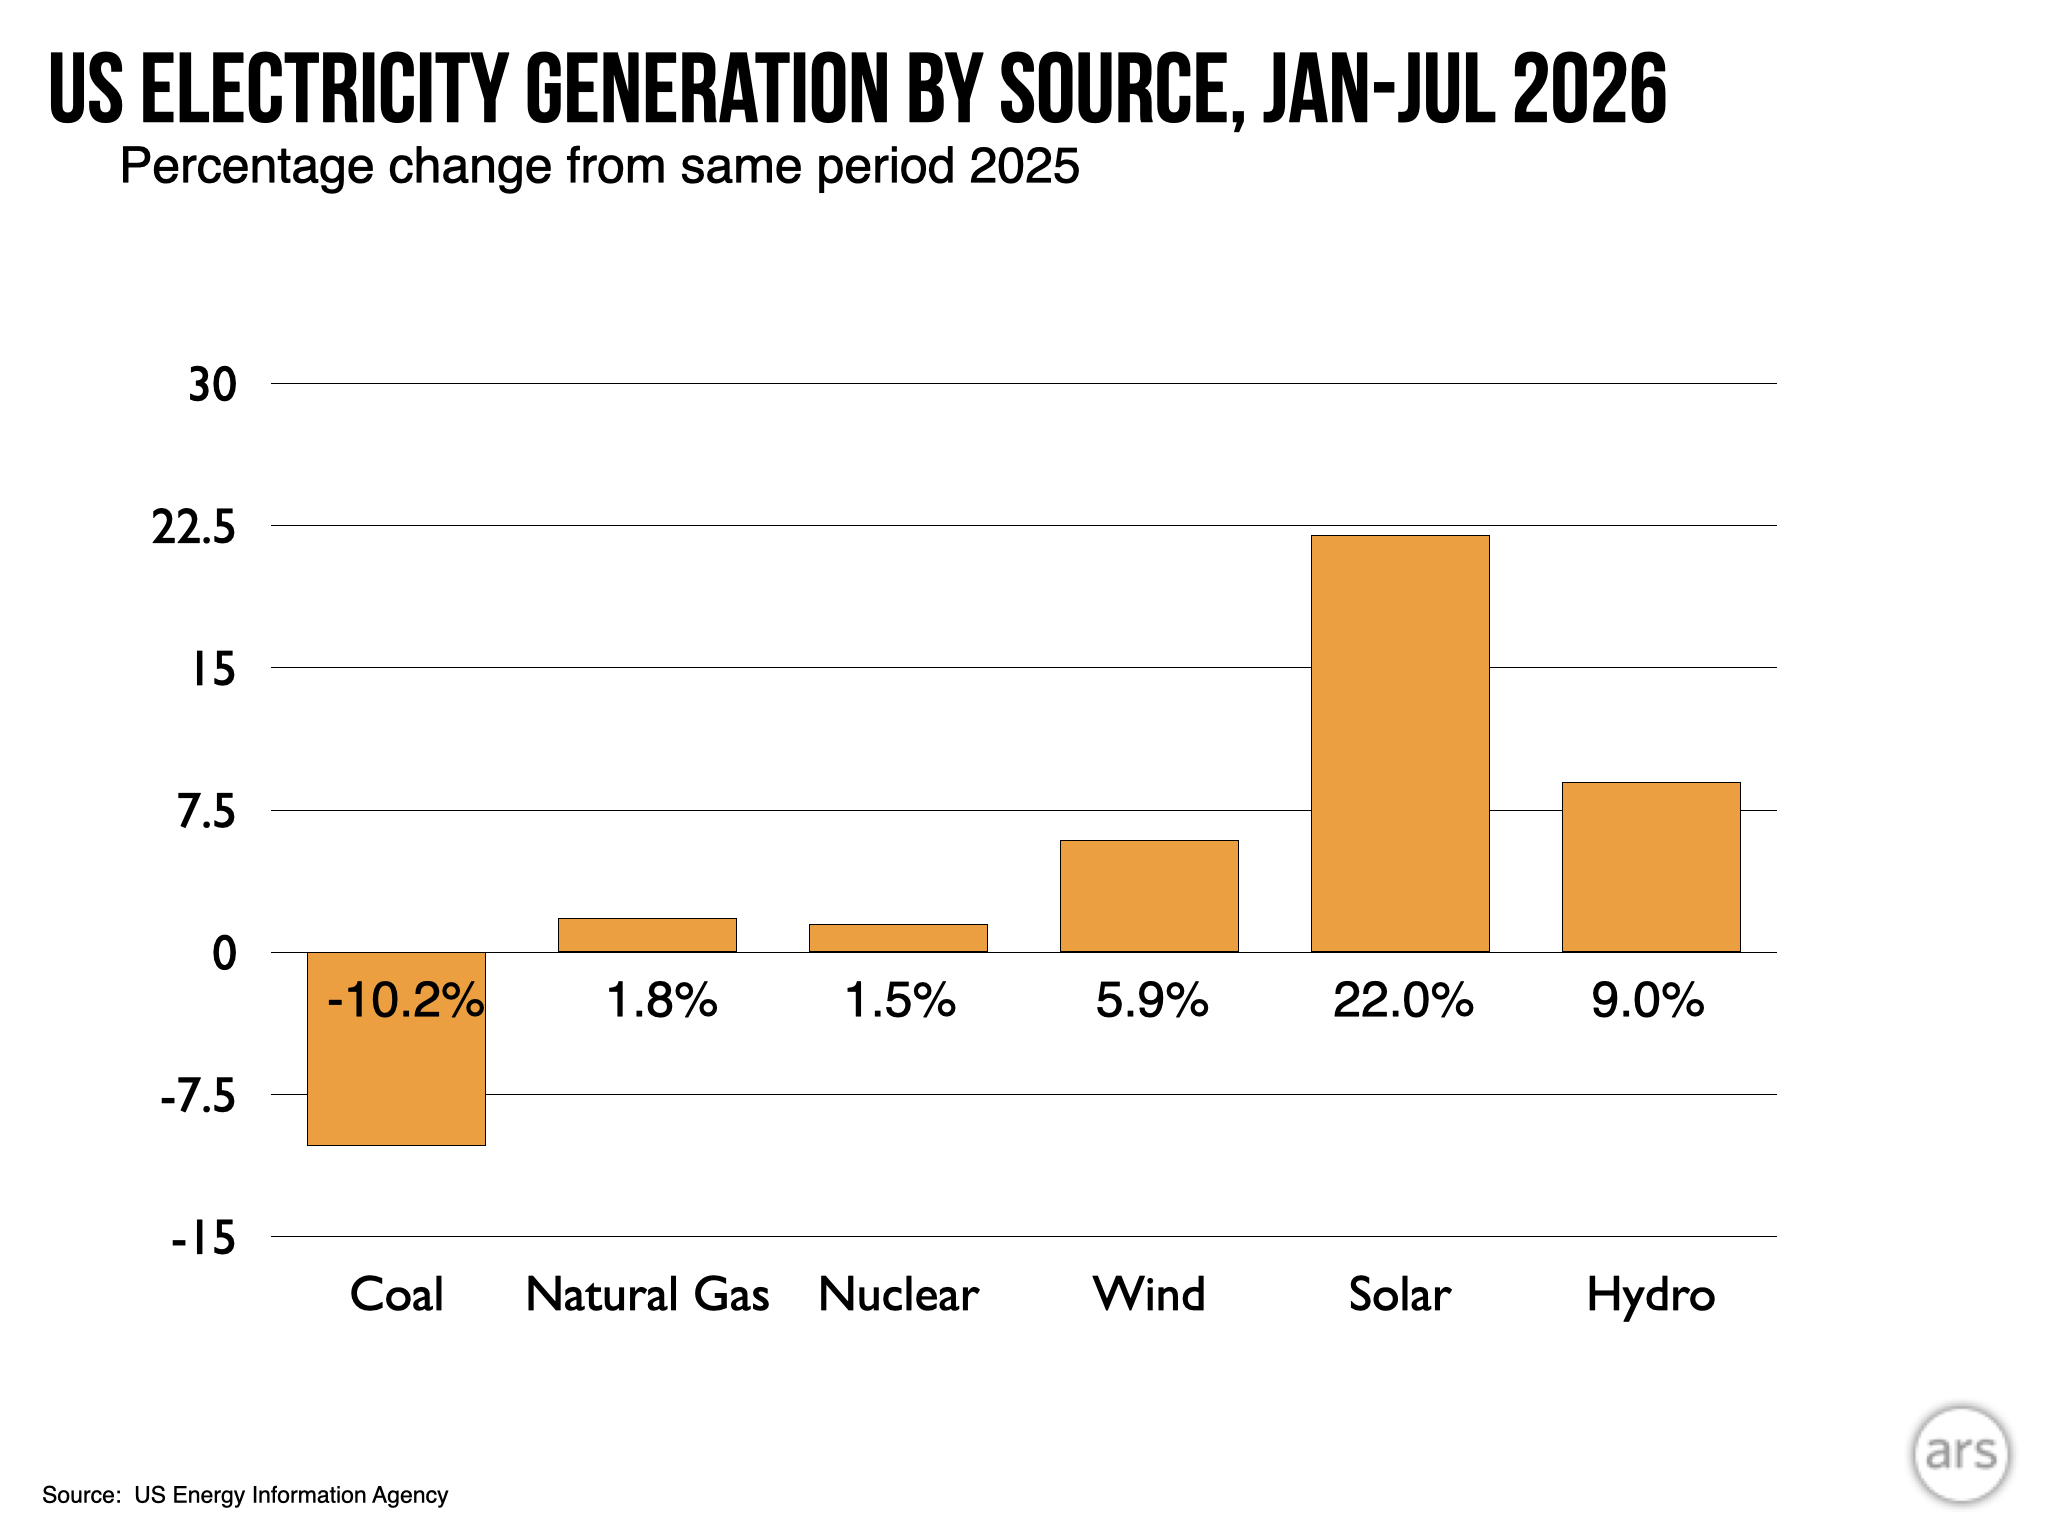
Solar added 39 terawatt-hours in the first seven months of 2026, down from 48 the year before. That's still a 22 percent increase, but a sharp drop from the 30-plus percent growth rates solar had been seeing.
Federal policy is hitting renewables
The Trump administration has removed incentives for renewable energy and paid developers to stop building offshore wind projects. This policy shift is likely slowing solar's previously explosive expansion.
Rooftop solar still growing steadily
Small-scale solar installations on rooftops grew over 12 percent year-over-year, slower than utility-scale solar but still solid growth.
Coal is collapsing fast
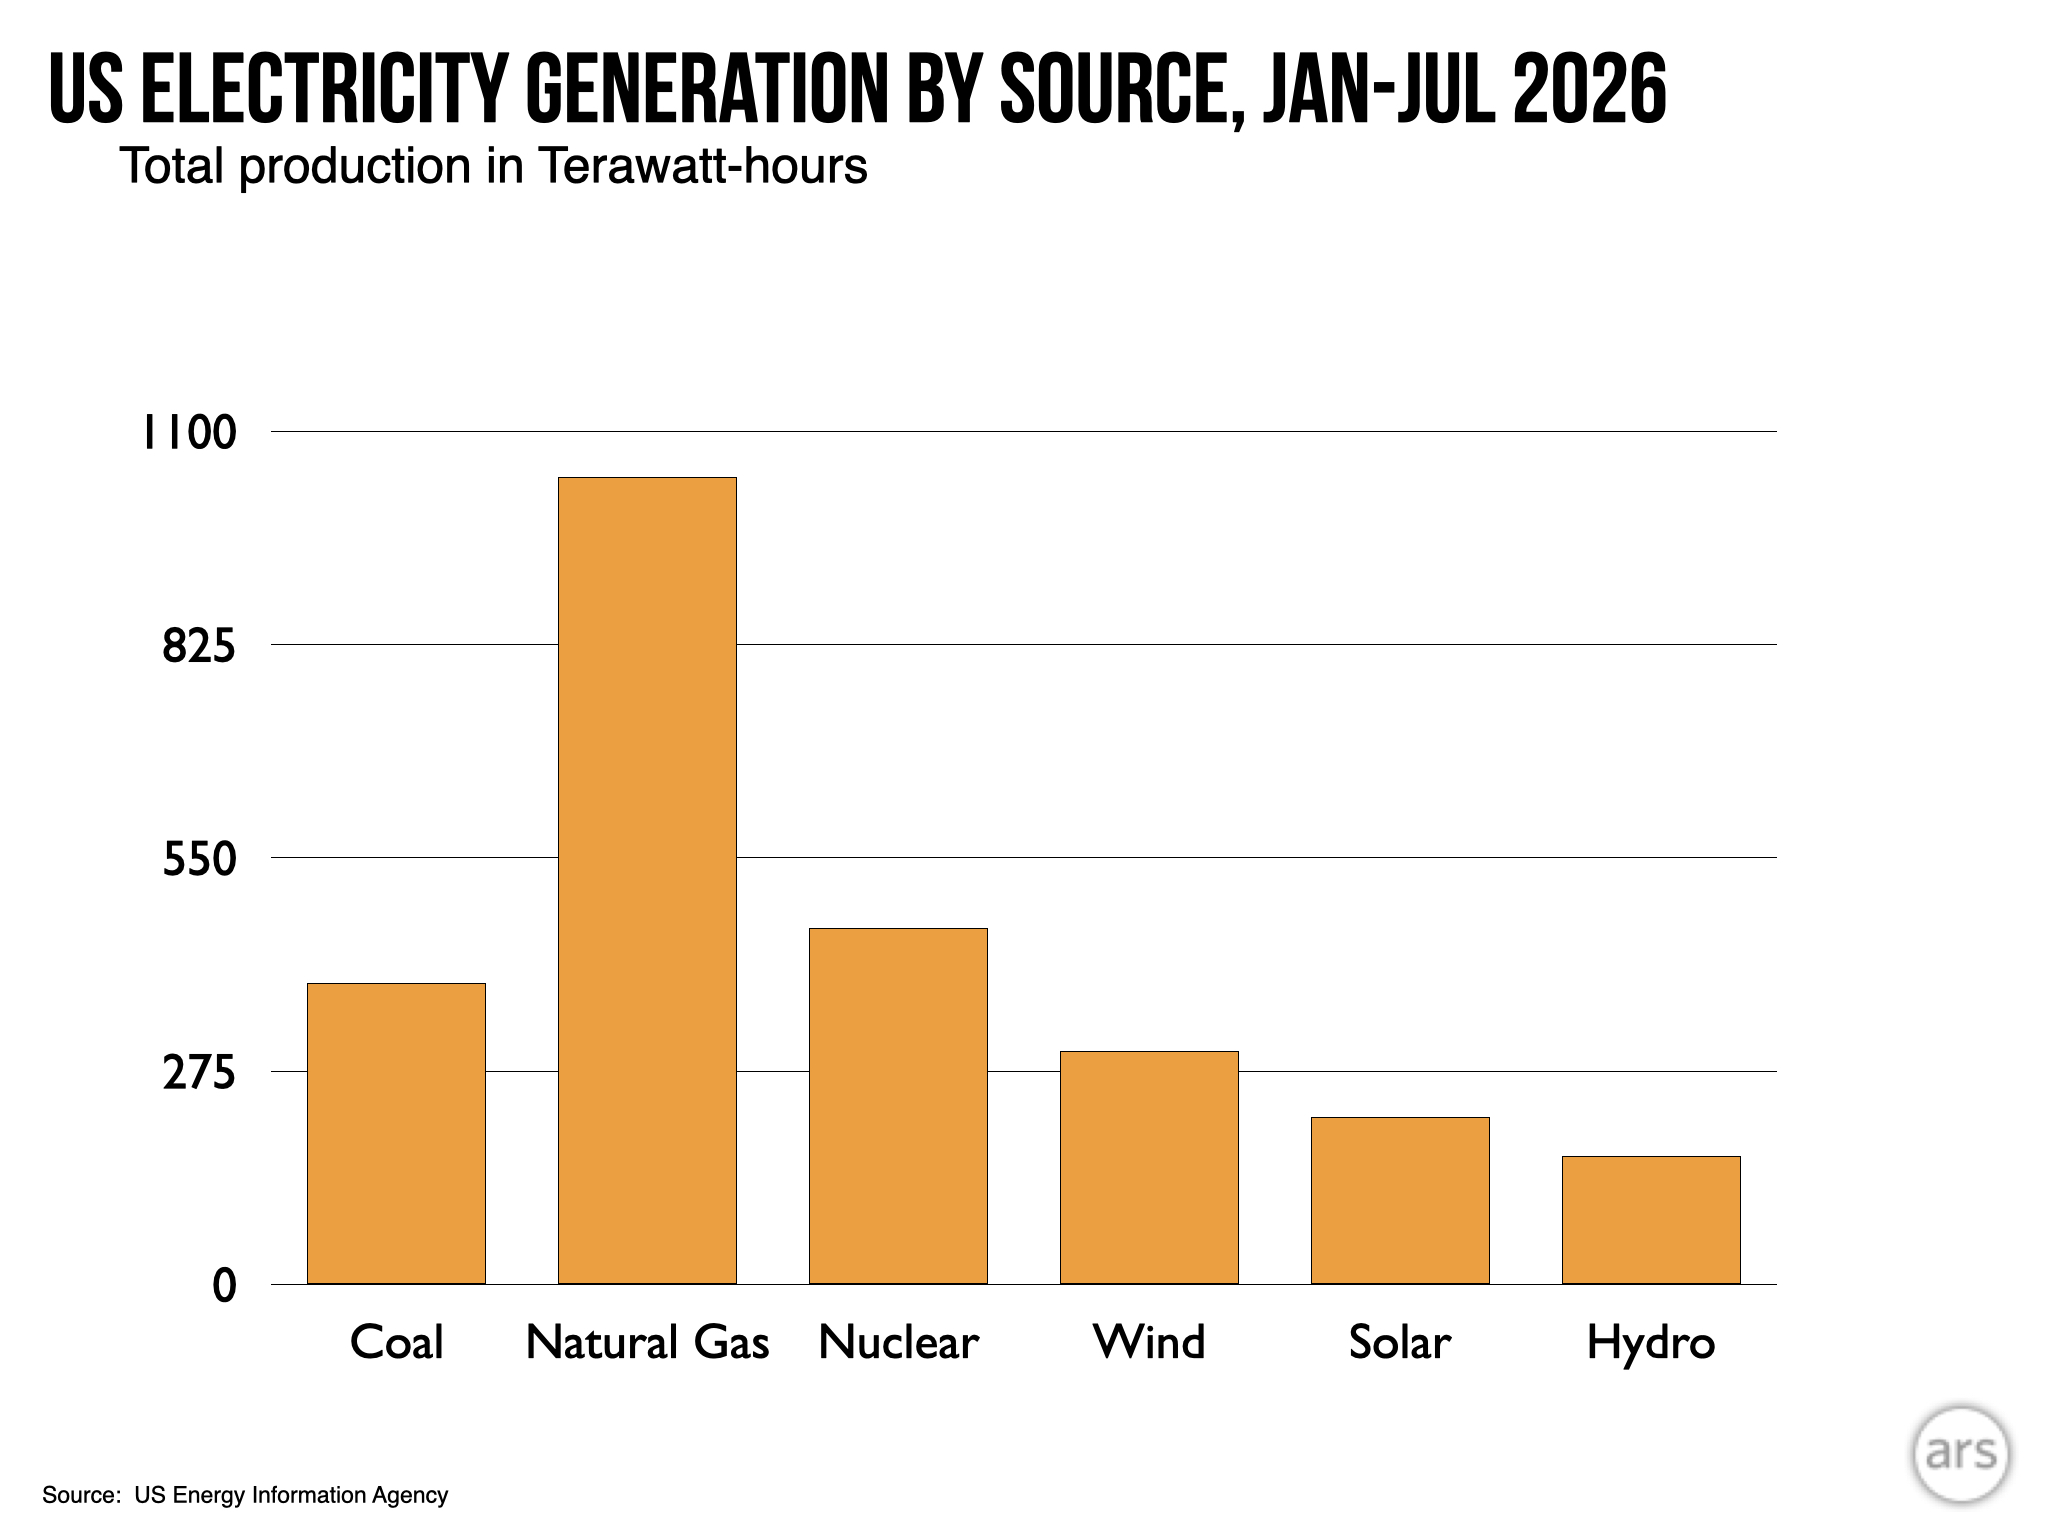
Coal generation fell over 10 percent in the first seven months of 2026. Solar now produces 72 percent as much electricity as coal, a dramatic shift in just a few years.
Wind and solar cover one-fifth of grid
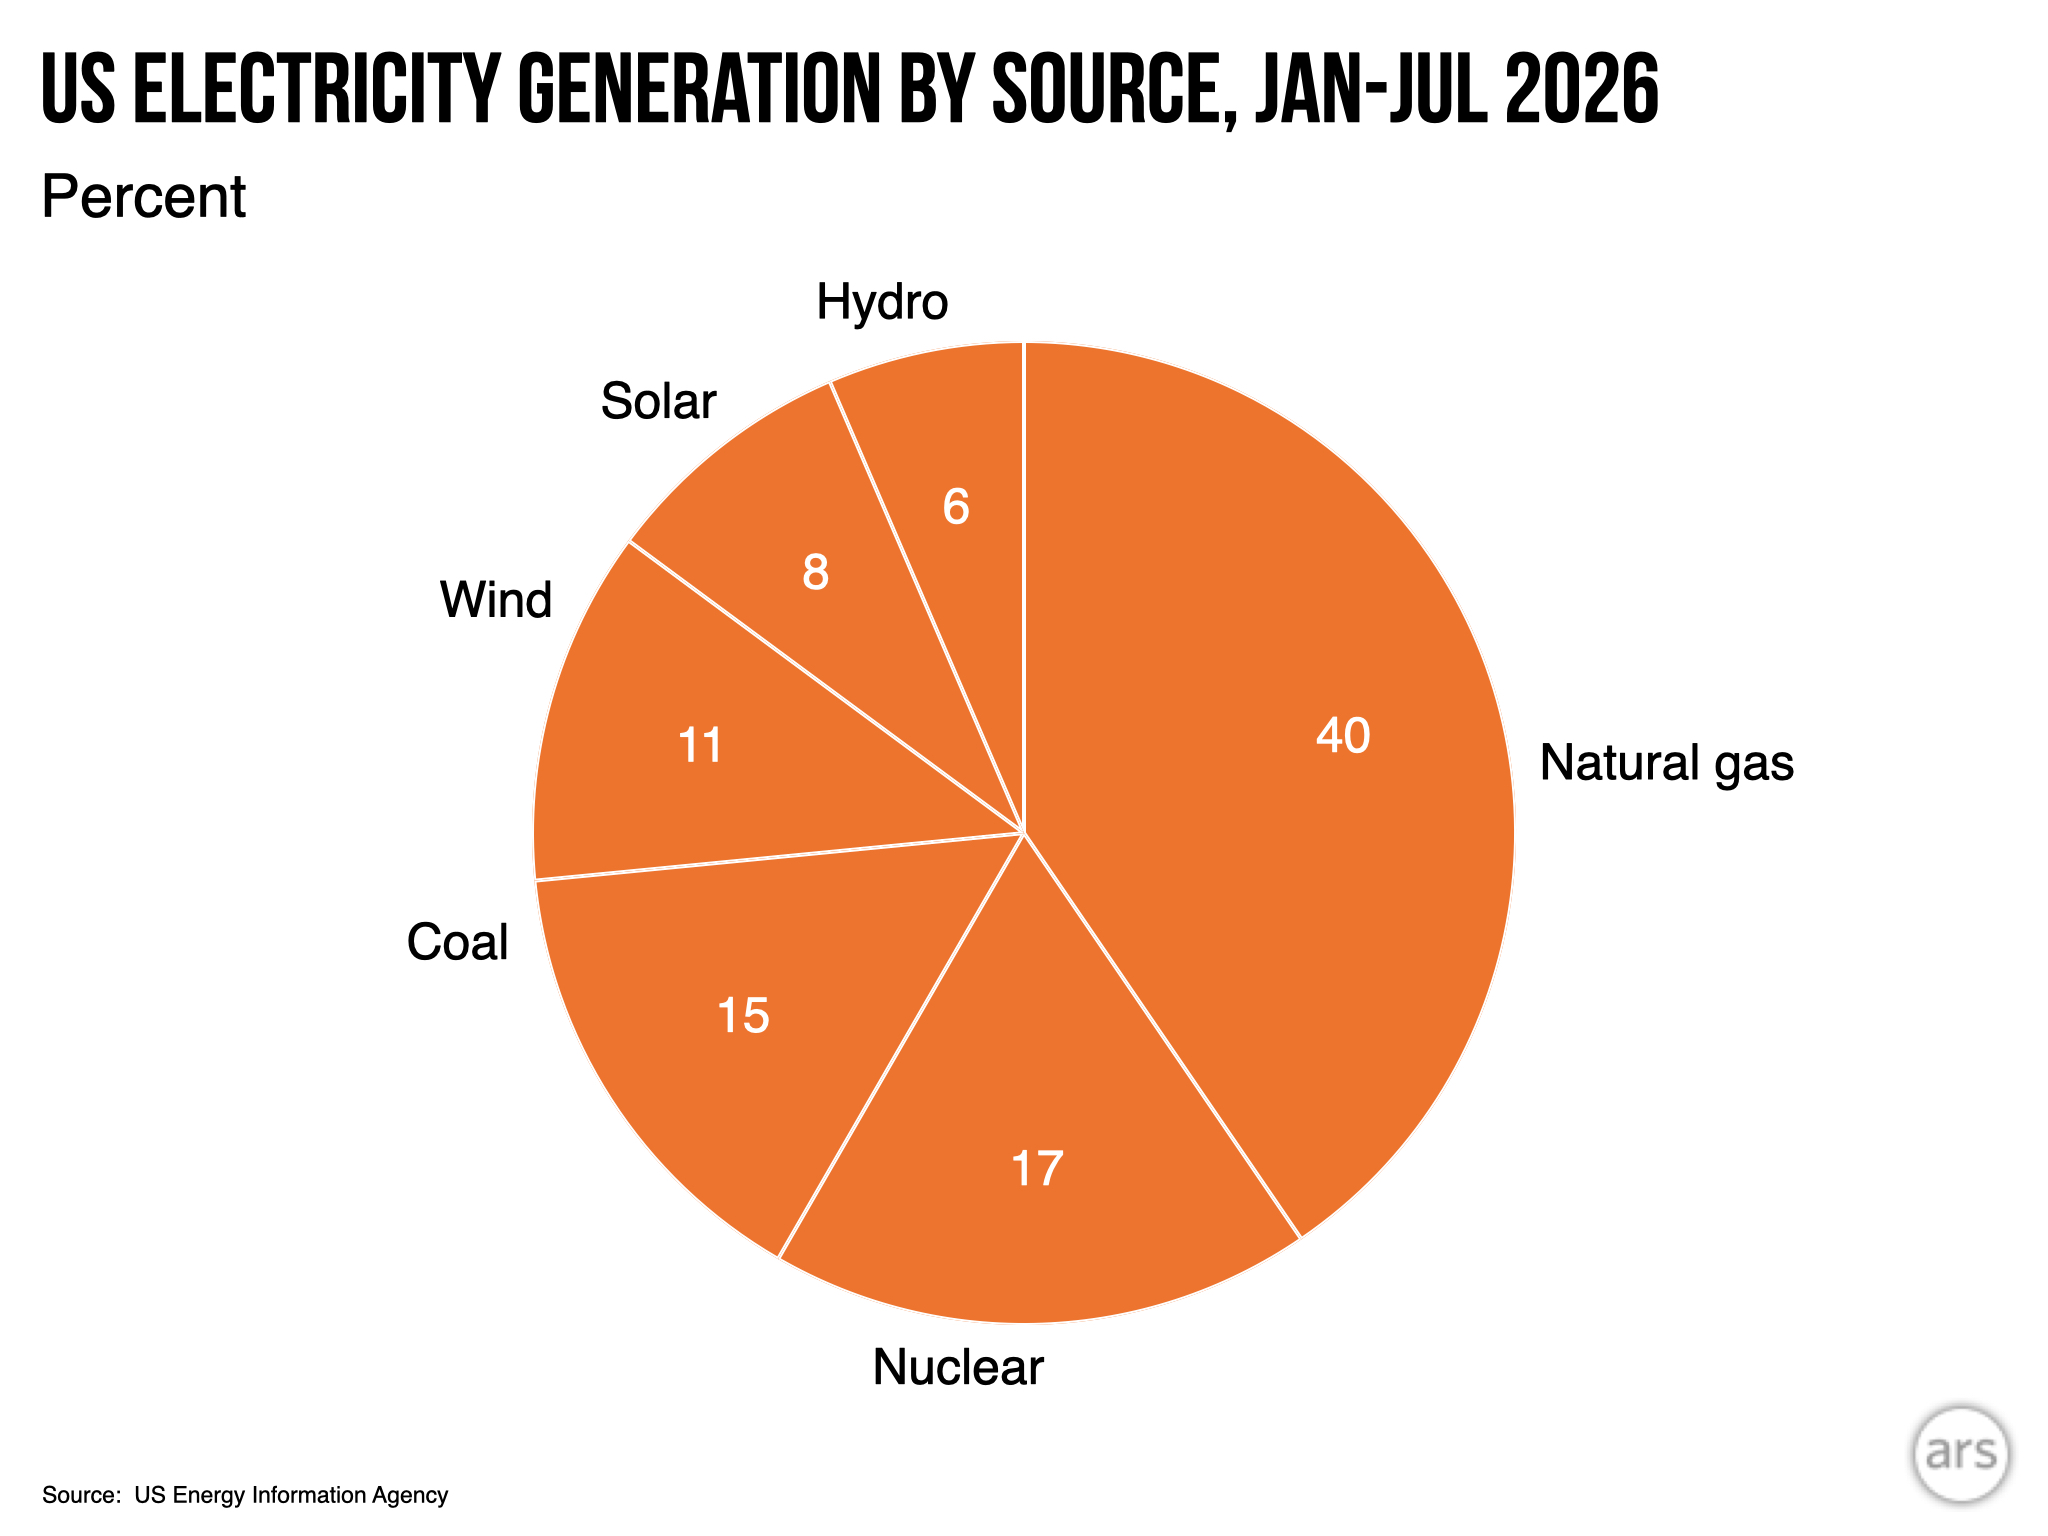
Wind and solar together now provide 21 percent of US electricity demand. In the first seven months of 2026, they alone generated 55 terawatt-hours of the 51 terawatt-hours in new demand.
Renewables hit 45 percent with nuclear
Adding hydro and nuclear to wind and solar, non-carbon sources now cover 45 percent of US electricity. The EU generates 65 percent emissions-free power, showing room for growth.
Offshore wind projects nearly finished
Two large offshore wind projects off the East Coast, including a 2.6 gigawatt facility near Virginia, will soon be completed. The Trump administration paid developers to halt similar projects, likely making these the last for the 2030s.
Solar spreads to colder regions
Michigan and Wisconsin are now seeing significant solar development, areas where economics didn't work just a few years ago. Onshore wind continues growing across the Midwest and Plains.
Battery storage is expanding nationwide
Grid batteries are spreading beyond California and Texas into Arizona, Colorado, Georgia, and Michigan. New solar installations are increasingly paired with battery systems to store power.
Coal and nuclear plants are done
No new coal plants have come online in 13 years, and none are being developed. No new nuclear plants will be completed soon. Only natural gas plants are being added in significant numbers.
What matters most
Solar growth dropped from 48 to 39 terawatt-hours year-over-year, but renewables still met all new electricity demand.