From Conviva · Melissa Pieroni · · 4m
We swapped mmap for io_uring and got 60% slower
A Rust query engine ditched mmap to escape page-cache thrashing, then watched io_uring lose badly to the thing it replaced.
In brief
A Rust query engine ditched mmap to escape page-cache thrashing, then watched io_uring lose badly to the thing it replaced. Bypassing the page cache only helps if the rest of your stack stops making the kernel manage memory for you, and a layer doing five jobs at once hides exactly that. Originally reported by Conviva.
mmap was the obvious choice
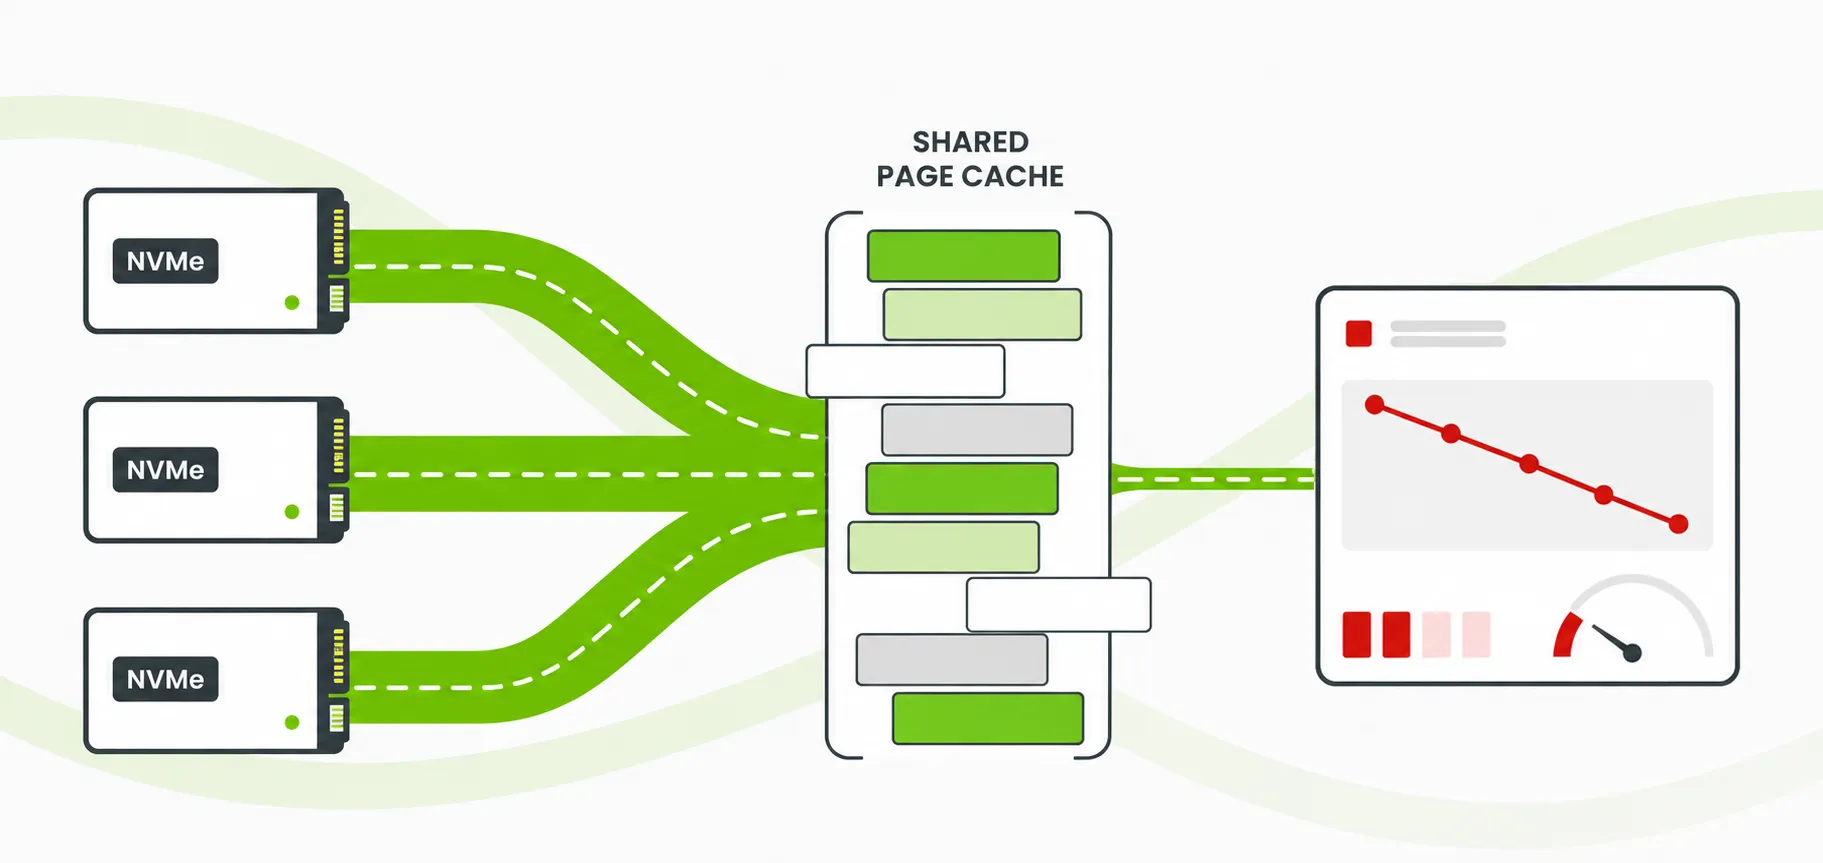
Arrow IPC files are laid out for zero-copy random access, and mmap hands you that for free. Huge files read lazily, no memory management code to write.
“In the beginning, there was mmap.”
Trillions of events a day
Conviva's engine runs on DataFusion, Arrow, Rust, Rayon and Tokio. Events land on local NVMe as 3 to 5 GB Arrow IPC files, and one query touches about 13 GB.
The box was not the limit
192 cores, 750 GB of RAM, and up to 32 NVMe drives in RAID-0 measuring 21 GB/s under fio. Plenty of headroom on paper.
Then concurrency hit
Light load was fine, queries in seconds. Under real concurrent load p95 went from 30 seconds to over 150, page faults exploded, and the page cache shrank.
More pods made it worse
The usual fix backfired. Adding pods dropped rows scanned per core instead of raising throughput, which is the fingerprint of a shared resource, not a CPU shortage.
“Adding pods made it worse, not better.”
One pod beat four
A controlled test on the same host: for 14-day queries, one pod was 41% faster at max and over 20% faster at p95. perf showed 100% kernel lock contention.
The page cache is shared state
Every process on a host shares one cache, one lock hierarchy, one eviction policy. No pod controls the resource that decides its read latency.
“mmap's page cache is implicit shared state.”
How a fault actually works
Touch an unmapped address, take a fault, the kernel looks up the VMA and takes a lock. Warm cache means a cheap minor fault. Cold means real disk I/O.
The major fault storm
pidstat caught RSS climbing to 98.91% of RAM. The kernel started evicting pages that were still needed, they got touched again, and major faults hit 1,352 per second.
Two million minor faults a second
Each one touches a cache line via atomics, so L1 and L2 get wiped. For an engine leaning on big cache-resident lookup tables, that alone is fatal.
“An uncontended minor fault costs roughly 0.5, 1 microsecond.”
Three terabytes of virtual space
Mapping that many Arrow files grew the address space to ~2.98 TB. Kernels handle large VMA trees, but every fault still pays for a lookup and a lock.
Context switches up 150x
Over 2 million context switches per second, against 14K on a warm-cache run. Threads blocked on faults, got descheduled, and came back when pages landed.
The kernel ate the CPU
On a cold run, __filemap_add_folio took 78% of samples and the actual query code fell from 45% of CPU to 5%. Same work, drowned out by page cache churn.
Disk was never the problem
Off-CPU time said it plainly: 31% blocked on futexes, 29% preempted by kernel readahead work, and only 6.9% on real NVMe latency.
Sixteen percent of the hardware
fio pushed 21.7 GB/s with io_uring and O_DIRECT, all 32 drives near 100% utilization. mmap peaked at 3.44 GB/s. That gap was the prize.
“That gap was the size of the prize.”
The io_uring plan
Bypass the page cache with O_DIRECT, submit reads through io_uring via the compio crate, coordinate with Tokio, decode Arrow inline. Own the cache instead of sharing one.
The Linux reality check
Major faults fell 35x, from 128,957 to 3,647. But minor faults rose 8x to 8.6 million, and query time went from 13.6s to 21.8s. About 60% slower.
“We'd traded one class of fault for another and lost on the trade.”
One layer, five jobs
The Batch Materialization Layer did I/O coordination, Arrow decode, cache management and the query API on a single thread. Clean on a whiteboard, impossible to fix in pieces.
Arrow was re-faulting everything
Buffer::from_slice_ref allocates and memcpys, so every 4 KiB destination page cost a minor fault. The Arrow layer was redoing the memory work io_uring had just skipped.
Still losing at 16 seconds
O_DIRECT bought 3 seconds, skipping the Arrow copy bought 3 more, and nothing else looked wrong. The real culprit, 40 concurrent submissions, waits for Part 2.
“nothing else in the design looked obviously wrong to us”
The big picture
Bypassing the page cache only helps if the rest of your stack stops making the kernel manage memory for you, and a layer doing five jobs at once hides exactly that.