From FCS Football Central On SI · · 3m
Week 2 FCS football by the numbers
Success rate reveals which teams truly dominated and which got lucky in Week 2 of FCS football.
In brief
Success rate reveals which teams truly dominated and which got lucky in Week 2 of FCS football. Success rate measures down-to-down efficiency better than final scores, revealing which teams are truly dominant and which won despite being outplayed. Originally reported by FCS Football Central On SI.
What success rate measures
Success rate tracks down-to-down efficiency. A play succeeds if it gains 50% of needed yards on first down, 70% on second, and 100% on third or fourth.
The benchmarks that matter
Average college football success rate is 40%. Closer to 50% is excellent, while under 30% is poor.
Southern Illinois holds SEMO down
The Salukis limited SEMO to 30% success rate with DJ Williams back. Explosive plays kept the Redhawks close despite poor down-to-down performance.
Tennessee Tech breaks through
The Golden Eagles cracked 50% success rate against Samford and finished as the 5th-most explosive team in the country.
North Dakota keeps rolling
The Fighting Hawks posted nearly 60% success rate for the second straight week. They face Nebraska next in a much tougher test.
Stephen F. Austin stuffs the run
The Lumberjacks posted a 41% stuff rate against Abilene Christian with 10 tackles for loss, holding them to 1.4 yards per carry.
South Dakota State dominates defensively
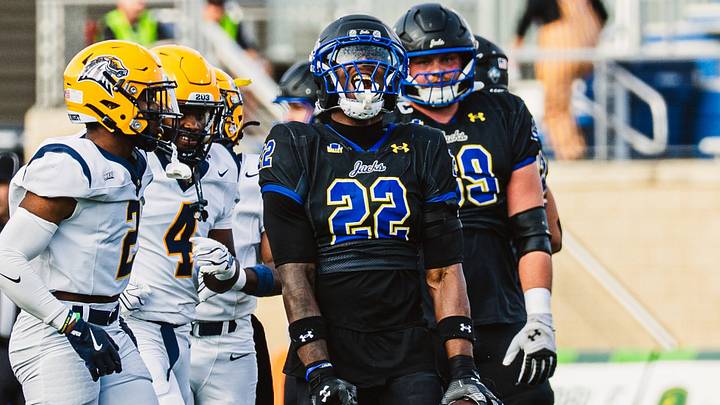
SDSU held New Haven to 13% success rate in non-garbage time. After one 43-yard drive, New Haven managed just 21 yards on their next eight drives.
Youngstown State's perfect offense
The Penguins posted a 70.6% success rate, best in the country. They hit 84% on passing plays in a nearly flawless performance.
“That's an impossible level of efficiency for this passing game.”
Austin Peay's explosive attack
The Govs had five runs of 25-plus yards and nine completions of 23-plus yards. Freshman Denver Harper averages 36.6 yards per reception.
Lehigh shreds William & Mary
Luke Yoder and the rushing attack posted 56% success rate. Running backs alone gained 338 yards on 7.5 yards per carry.
South Dakota finds a pass rush
Charles Pierre Jr. rushed for 159 yards on 16 touches. The Yotes generated 33% pressure rate and five sacks after managing only 18 all last season.
UAlbany emerges in the CAA
The Great Danes are one play from being undefeated with an FBS win. Their passing game finally clicked, making them more well-rounded.
North Alabama outplays but loses
UNA posted 56.3% success rate but lost to Southeastern Louisiana. Two turnovers in SLU territory, a missed field goal, and 11 penalties cost them.
“UNA outplayed SLU for a majority of the game, but SLU won the game in key moments.”
Incarnate Word's turnover disaster
UIW gained 606 yards to Northern Arizona's 333 but lost by double digits. Three interceptions and three fumbles, plus a missed field goal, doomed them.
Rhode Island wins ugly
The Rams had only 286 yards and went 3-and-out on their first five drives. The 21-point margin came from Elon's five turnovers, not offensive dominance.
Montana survives Utah Tech
The Griz won by 21 but got outplayed down-to-down. Utah Tech fumbled twice in Montana territory and missed two field goals.
“The expected points for Utah Tech were probably closer to 24, but the Trailblazers didn't capitalize on those opportunities.”
The short version
Success rate measures down-to-down efficiency better than final scores, revealing which teams are truly dominant and which won despite being outplayed.