From MoneyWeek · · 2m
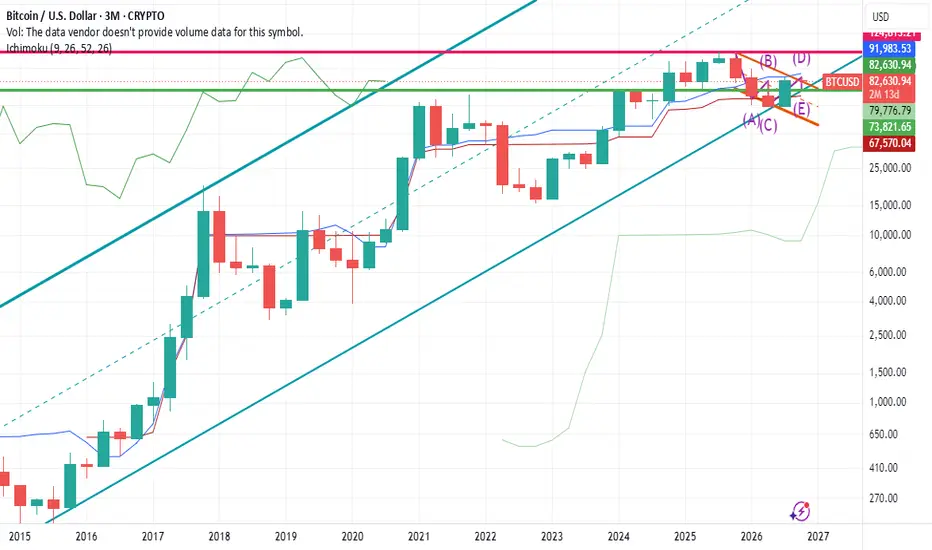
Technical Analysis Dead?
Finance industry abandoned chartism as computers took over trading.
In brief
Finance industry abandoned chartism as computers took over trading. Technical analysis still works for short-term trading but not for long-term market predictions. Originally reported by MoneyWeek.
Technical Analysis History

Robert Edwards and John Magee's 1948 book remains the Bible of technical analysis despite being outdated for modern finance.
“Technical Analysis of Stock Trends”
Certification Shifts
The Chartered Market Technician Association has 2,500 active charterholders while the CFA Institute has 200,000 charterholders.
“2,500 active charterholders”
Why Technical Analysis Declined
Computers replaced manual chart analysis, allowing quantitative models to outperform traditional chart-based strategies.
“Computers took over”
Technical Analysis Limitations

Technical analysis is limited to two dimensions of data and requires statistical models that many investors cannot access.
“two dimensions of data”
Jesse Livermore's Success
Jesse Livermore made significant profits during the 1929 Wall Street Crash using minimal data like ticker tape.
“Wall Street Crash of 1929”
Academic Validation
Academics found technical analysis strategies could work for short-term trading but not for long-term market predictions.
“Dow Jones index from 1897 to 1”
Data Dredging Problem
Overfitting technical analysis models leads to false signals that work only in backtests.
“back-test to perfection”
Quantitative Finance Rise
Hedge funds like LTCM used complex models to achieve 35% annual returns before collapsing in 1998.
“LTCM”
Market Crises
The Asian financial crisis of 1997 and dotcom crash of 2000 exposed the risks of overreliance on technical analysis.
“Asian financial crisis of 1997”
Modern Technical Analysis
Testable momentum signals are used in quantitative finance while chart patterns remain popular among retail investors.
“Testable momentum signals”
Key Technical Terms
Volume bars, trading ranges, moving averages, and Bollinger bands are essential charting tools for technical analysts.
“Volume Bars”
Chart Patterns
Triple tops, divergences, and head-and-shoulders patterns are common technical analysis indicators.
“Triple Top”
Elliott Waves Theory
Elliott Waves theory predicts market movements through five waves in the direction of the trend followed by three corrective waves.
“Elliott Waves”
Current Status
Technical analysis works for short-term trading but not for long-term market predictions.
“short-term trading”
Conclusion
Technical analysis remains relevant for short-term strategies but has lost its place in mainstream finance.
“never rebranded”
What matters most
Technical analysis still works for short-term trading but not for long-term market predictions.