From TradingView · · 3m
16 Elliott Wave Guidelines for Traders
Master Elliott Wave analysis with practical rules for identifying market structure, entry points, and risk management.
In brief
Master Elliott Wave analysis with practical rules for identifying market structure, entry points, and risk management. Elliott Wave works best as part of a broader trading framework combined with price action, support/resistance, and other indicators, not as a standalone signal. Originally reported by TradingView.
Focus on the tradable waves
Waves 1, 3, 5, and C are the main waves traders analyze. Waves 1, 3, and 5 are impulsive movements that show trends, while Wave C is part of corrective structures.
Wave 3 is usually strongest
Wave 3 typically shows the strongest momentum, highest trading activity, and greatest trader participation. It should never be the shortest of the three impulsive waves.
“Wave 3 is typically the strongest and most dynamic wave of an Elliott Wave impulse.”
Impulsive waves break into five
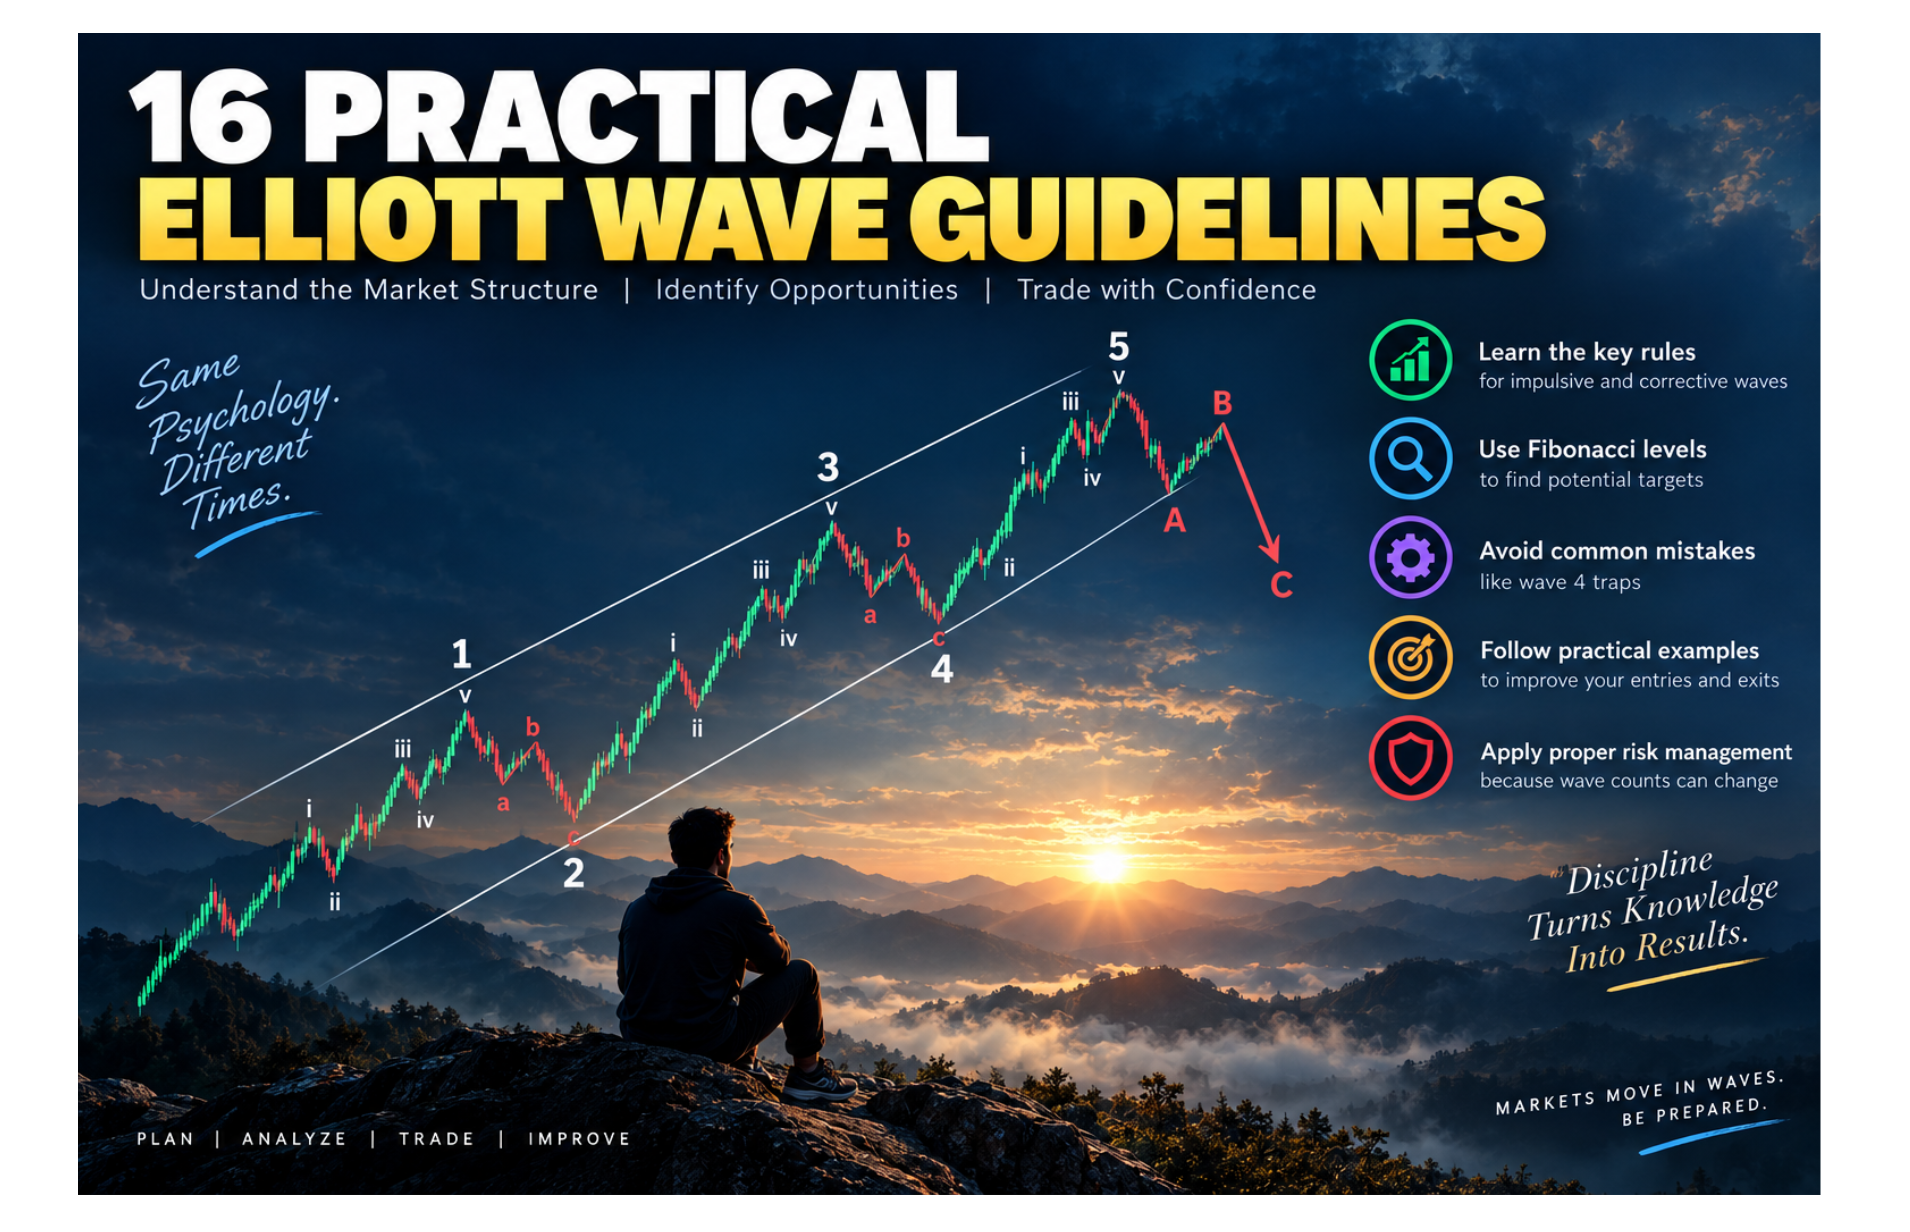
Waves 1, 3, and 5 normally develop into five smaller waves each: 1, 2, 3, 4, 5. Corrections within these structures typically appear as A-B-C patterns.
Wave 5 volume can drop
Wave 5 often develops with lower volume than Wave 3, even as price continues in the same direction. Lower volume alone does not signal the trend has ended.
Wave 5 can fail or truncate
Not every Wave 5 moves beyond the high or low set by Wave 3. A failed fifth wave creates a double-top or double-bottom instead of a new extreme.
“A failed fifth wave, sometimes called a truncated fifth, can result in a double-top or double-bottom type structure.”
Combine with other signals

Use Elliott Wave alongside price action, support and resistance, Fibonacci levels, volume, momentum indicators, and moving averages. This builds a grounded assessment rather than relying on subjective wave counts alone.
Be patient with Wave 4
Wave 4 corrections can become complicated. Wait for a clear A-B-C structure to develop before assuming Wave 4 has ended. Use Fibonacci retracement levels as reference points.
Alternation between waves 2 and 4
If Wave 2 is simple, Wave 4 tends to be complex. If Wave 2 is complex, Wave 4 tends to be simple. This alternation pattern is a guideline, not a guarantee.
Wave 2 retracement statistics
About 73 percent of Wave 2 corrections retrace between 50 and 60 percent of Wave 1. About 12 percent retrace less than 38 percent, and about 15 percent retrace beyond 62 percent.
Wave 3 can extend significantly
Wave 3 can become much larger than Wave 1, ranging from 1.0 to 1.6 times Wave 1 up to greater than 2.62 times. Avoid assuming strong Wave 3 movements must end at small targets.
Wave 4 retracement zones
Wave 4 commonly retraces 30 to 50 percent of Wave 3, with some retracing around 24 to 30 percent or 50 to 62 percent. Use these as areas of interest, not automatic signals.
Wave counts can always change
An Elliott Wave count is an interpretation that changes as price develops. Never let a wave count override risk management. Always define your invalidation level and respect your stop-loss.
“Never let a wave count override your risk-management rules.”
The key point
Elliott Wave works best as part of a broader trading framework combined with price action, support/resistance, and other indicators, not as a standalone signal.