From TradingView · · 1m 20s
A 15-minute breakout call on MET
A trader spots MET/USD pushing through resistance and puts a number on the move.
In brief
A trader spots MET/USD pushing through resistance and puts a number on the move. The setup is a measured move off a tight consolidation, so the +22% target only holds while price stays above the broken resistance. Originally reported by TradingView.
A long call on MET
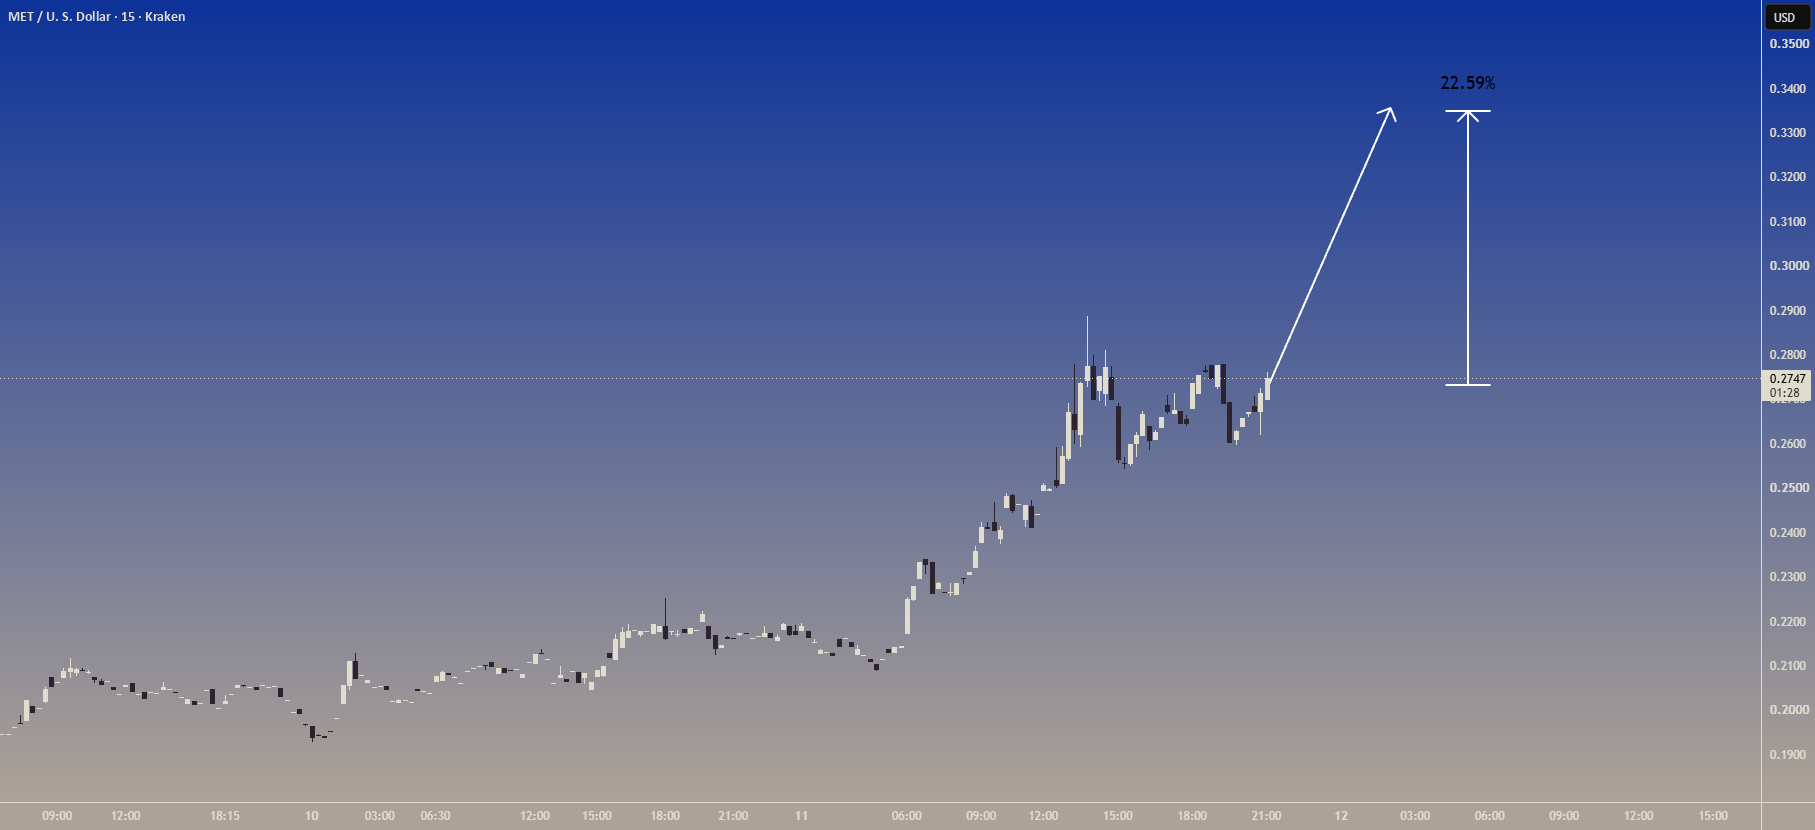
Trader larix published a bullish setup on MET/USD as it trades on Kraken. The position is a long, posted to TradingView for other traders to pick apart.
The 15-minute chart
The whole read sits on the 15m timeframe. That is a fast, intraday window, so the signal is about the next hours rather than the next months.
“MET/USD is showing a strong bullish breakout setup on the 15m chart”
Price cleared resistance
The trigger is price moving above a level that had been capping it. Until that break, the ceiling held; once it gave way, the setup turned active.
“moving above key resistance”
Where the target comes from
The +22% figure is a measured move. You take the height of the consolidation range before the break and project it upward from the breakout point.
“Based on the measured move from the recent consolidation”
Waiting for follow-through
The call ends on monitoring, not certainty. A breakout still needs continuation to pay, and price falling back under the old resistance kills the thesis.
“Monitoring for continuation.”
Not advice, by design
TradingView states plainly that ideas posted there are not financial or investment advice, and it does not endorse them. This is one trader's read, published in public.
“The information and publications are not meant to be, and do not constitute, financial, investment, trading, or other types of advice”
What matters most
The setup is a measured move off a tight consolidation, so the +22% target only holds while price stays above the broken resistance.