From TradingView · · 1m 30s
A BTC chart you can copy, not a call
A weekly Bitcoin chart post that hands you the levels instead of telling you what to do with them.
In brief
A weekly Bitcoin chart post that hands you the levels instead of telling you what to do with them. The value here is the chart environment itself: copy it, save it as your own layout, then form your own view on the levels. Originally reported by TradingView.
One week, one chart
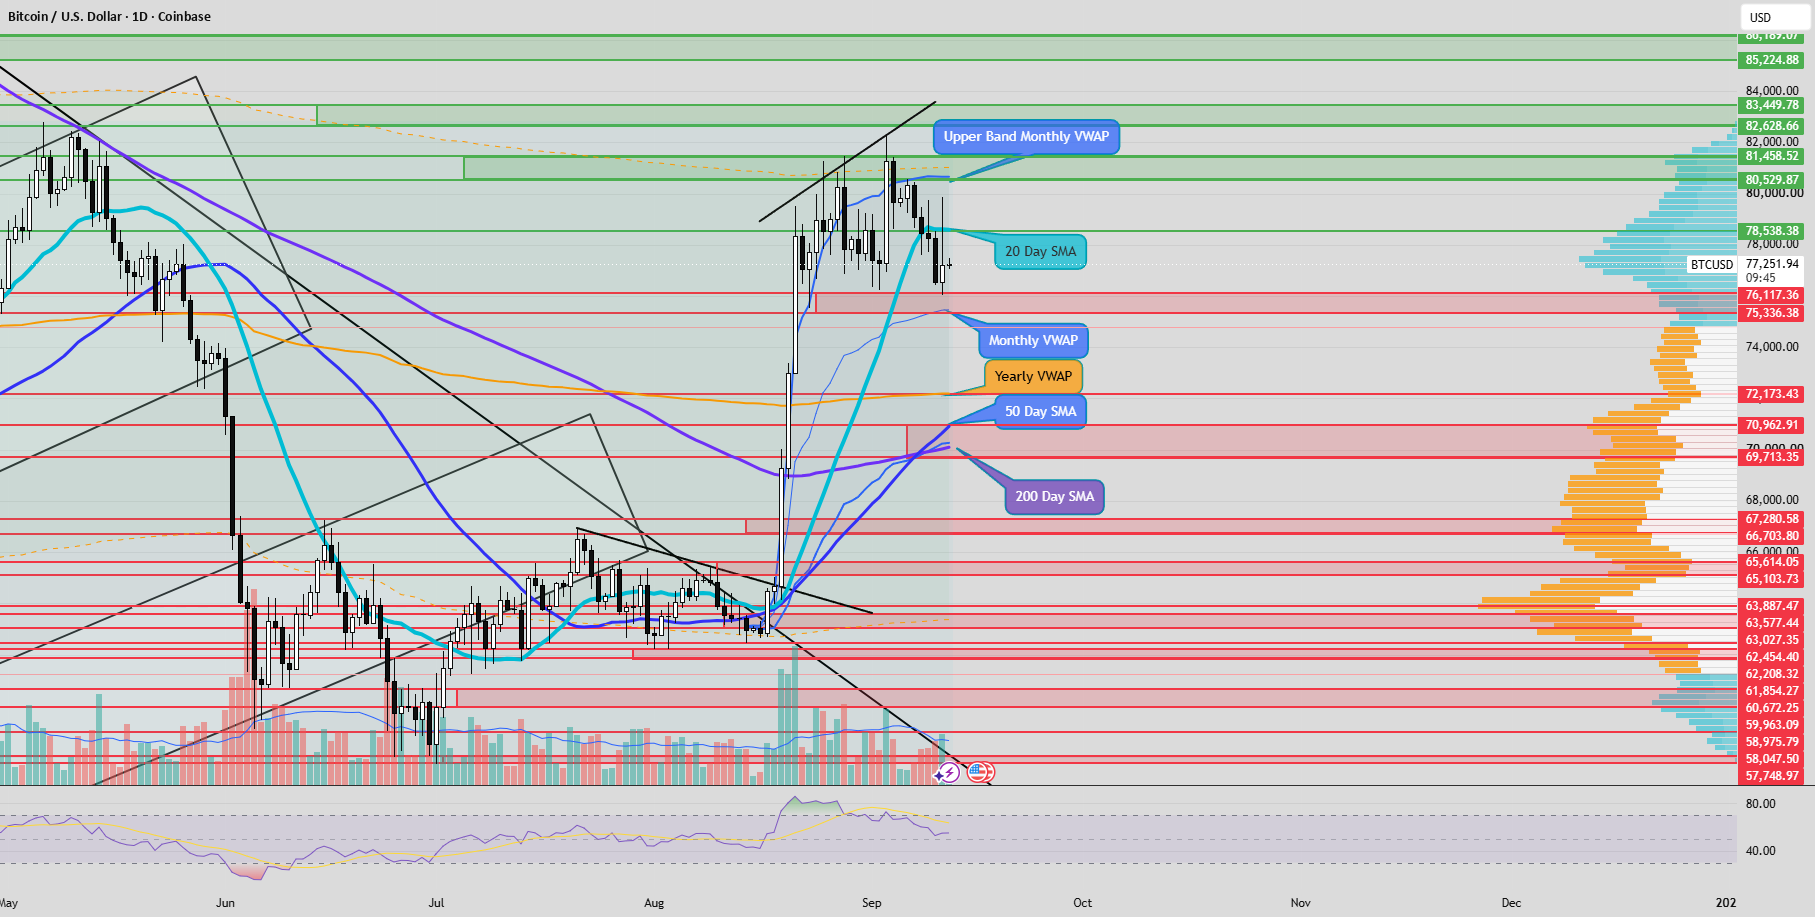
A trader posting as ryani8877 shared a Bitcoin chart for the week of Sept 14, marked up with levels and key areas on COINBASE:BTCUSD.
“BTC - Week of Sept 14”
Levels, not predictions
The post points to zones on the chart rather than spelling out a trade. You read the areas and decide what they mean for your own plan.
“See levels and key areas for this week”
Grab this chart
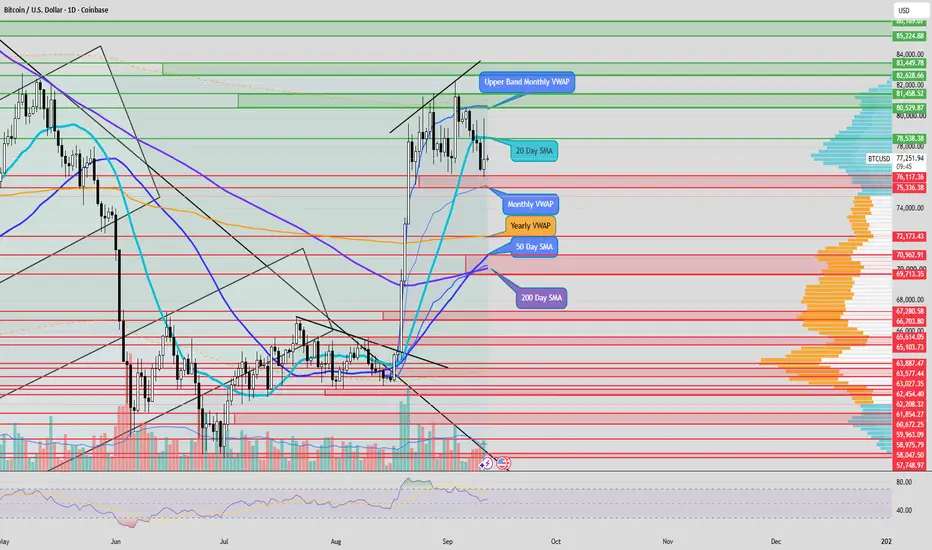
Click the link, then hit Grab this Chart at the bottom right, or Load Live Bars on the middle right edge. That opens a working copy of the whole chart setup.
Copies do not save themselves
Grabbing the chart opens the environment but never writes it to your dashboard. Close the tab and the markup is gone.
“it doesn't automatically save as a permanent layout in your dashboard”
Save it as your own
Click the cloud icon at the top of TradingView, choose Save As, and name the layout. It then lives in your saved layouts for every session after.
Nobody is advising you
TradingView states plainly that posts like this are not financial, investment, or trading advice, and the platform does not endorse them. Treat the levels as one person's read.
“The information and publications are not meant to be, and do not constitute, financial, investment, trading, or other types of advice”
The one thing
The value here is the chart environment itself: copy it, save it as your own layout, then form your own view on the levels.