From TradingView · · 1m 10s
A fifth Bitcoin cycle, mapped
A TradingView trader charts Bitcoin's past cycles and marks where the next top could land.
In brief
A TradingView trader charts Bitcoin's past cycles and marks where the next top could land. The setup is a long call built on cycle repetition: accumulate now, watch the projected top range later. It is one trader's chart, not a forecast to trade blind. Originally reported by TradingView.
A long call on BTC
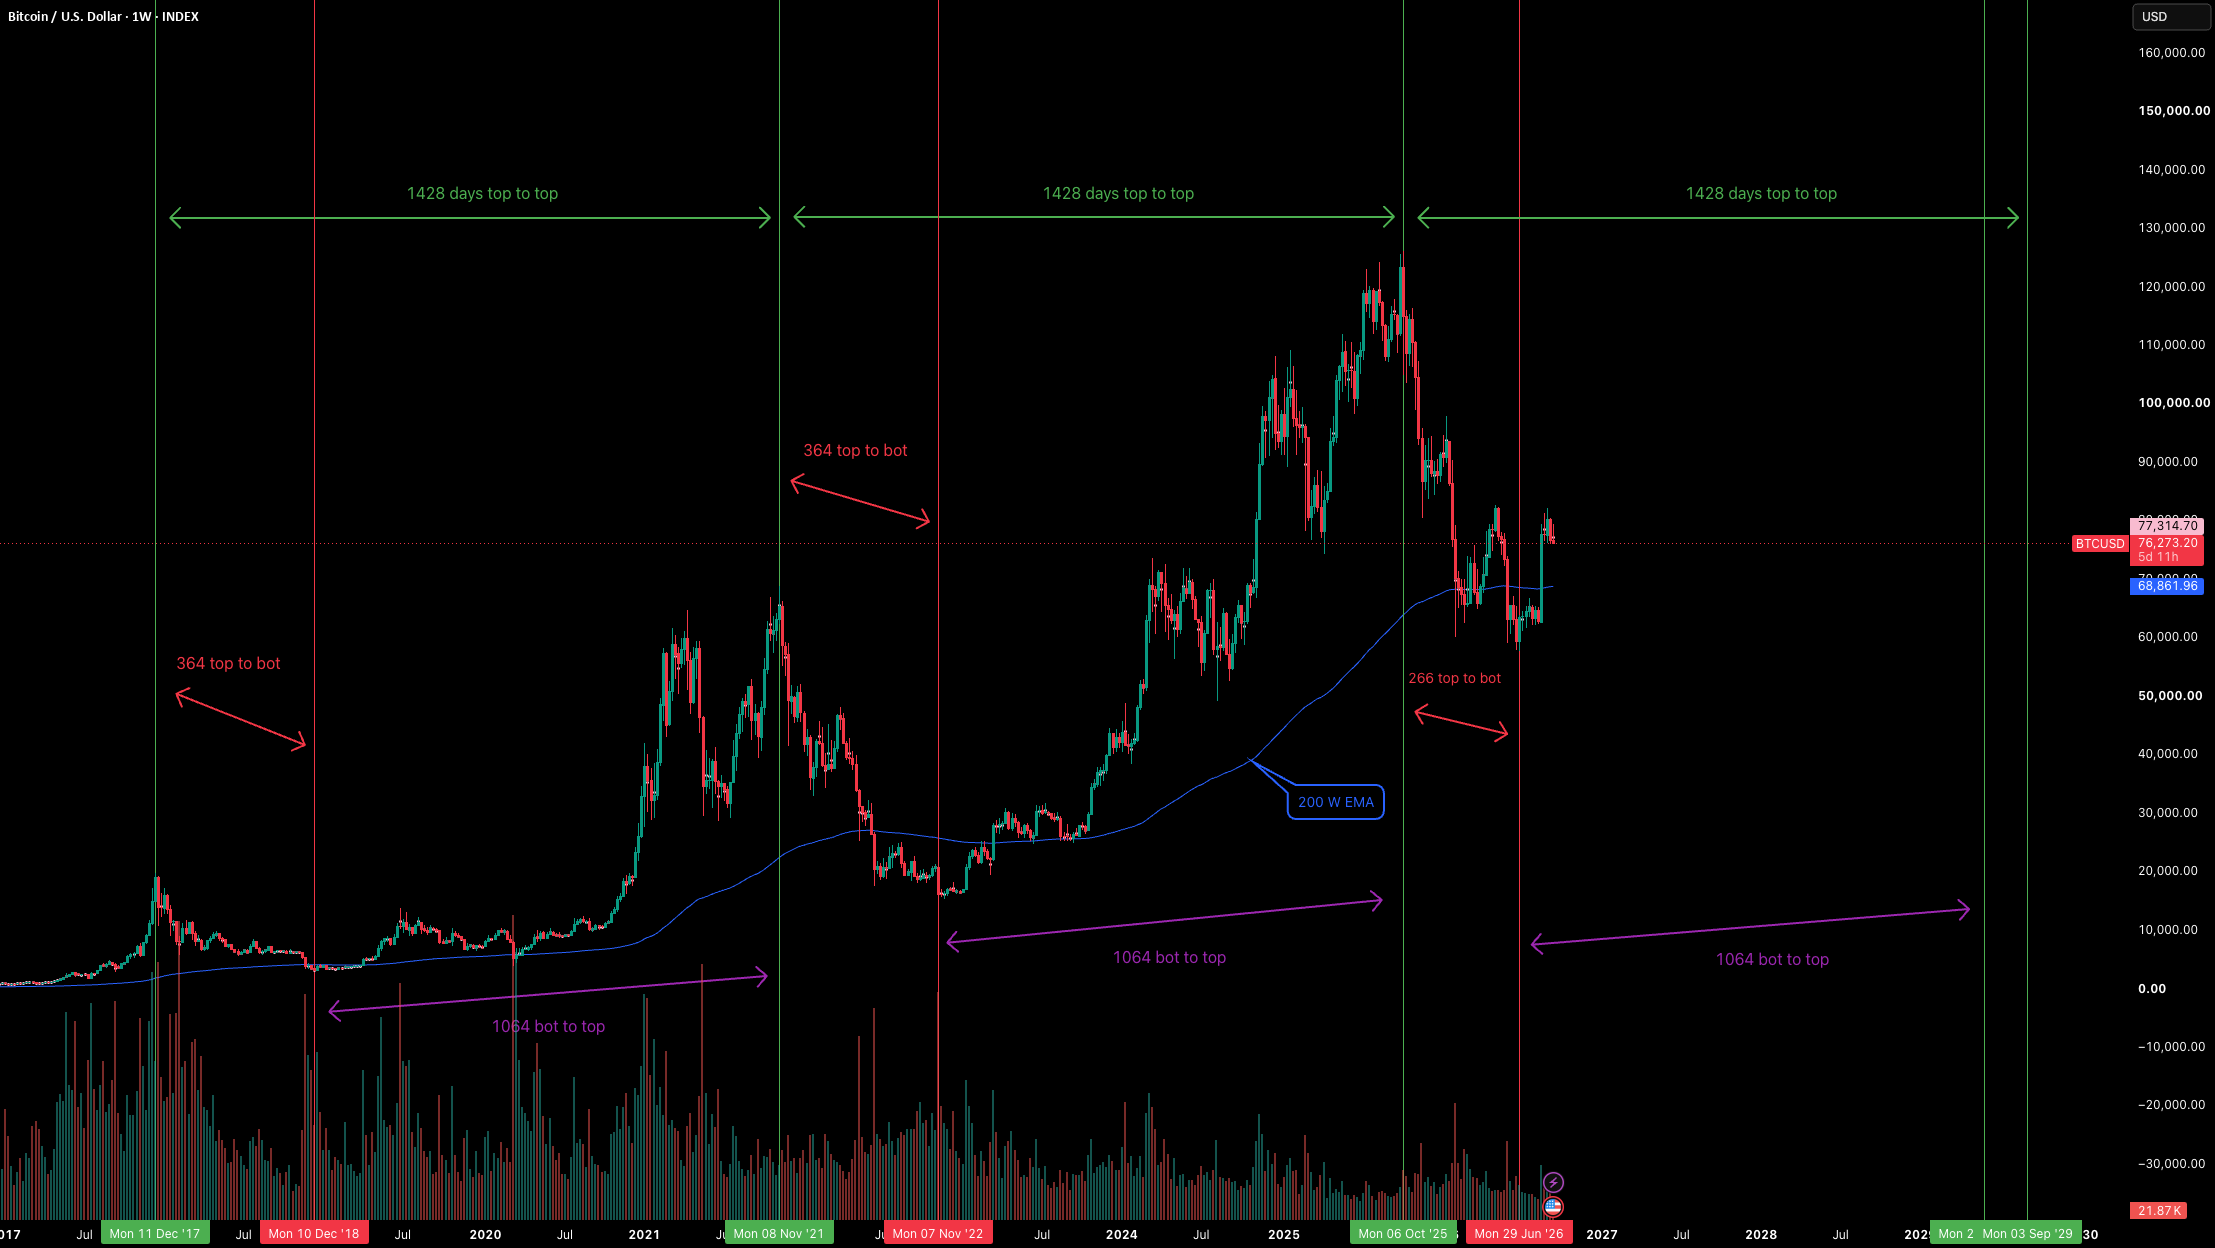
Trader gabantrading posted a long idea on INDEX:BTCUSD, framing it as the fifth Bitcoin cycle rather than a short term trade.
Past cycles as the template
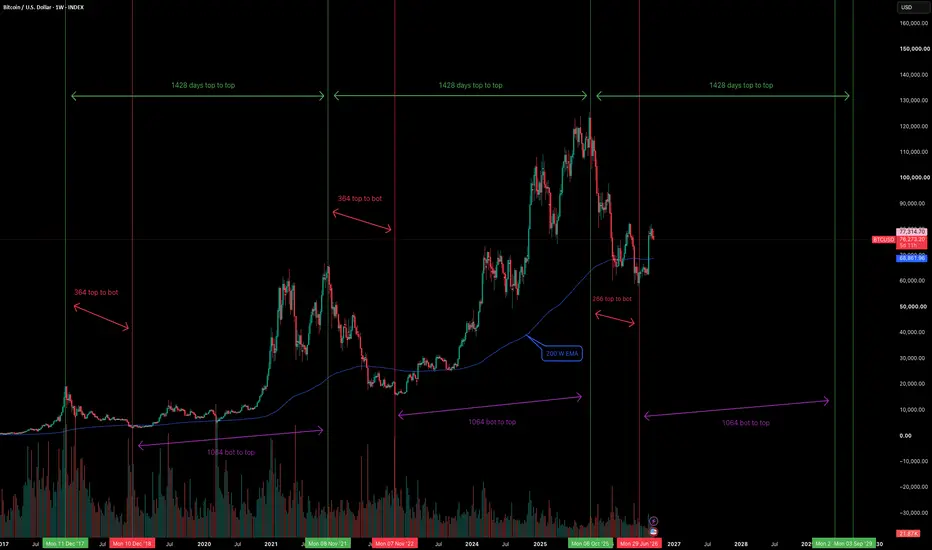
The chart starts by marking Bitcoin's recent completed cycles. The bet is that the shape of previous runs tells you something about the shape of the next one.
“Capture the previous Bitcoin recent cycles”
Projecting a top range
Instead of naming a single price target, the idea sketches potential top point ranges for the cycle ahead. A band, not a number.
“Projecting out potential top point ranges for this next cycle”
We are accumulating
The current phase, in the author's read, is accumulation. That places the chart before the run, not inside it.
“We are in accumulation mode”
Read it as one opinion
TradingView attaches a disclaimer to every published idea. Nothing here is endorsed advice, and a cycle projection is a hypothesis that price can ignore.
“The information and publications are not meant to be, and do not constitute, financial, investment, trading, or other types of advice”
Here's the gist
The setup is a long call built on cycle repetition: accumulate now, watch the projected top range later. It is one trader's chart, not a forecast to trade blind.