From TradingView · · 1m 40s
A South Korea ETF chart with a bearish warning attached
A TradingView analyst reads the South Korea ETF as topping out, and thinks the rest of the world could follow.
In brief
A TradingView analyst reads the South Korea ETF as topping out, and thinks the rest of the world could follow. This is one trader's Elliott Wave read on a single chart, not evidence. Treat the contagion claim as a hypothesis to watch, not a forecast to act on. Originally reported by TradingView.
One chart, one bearish call
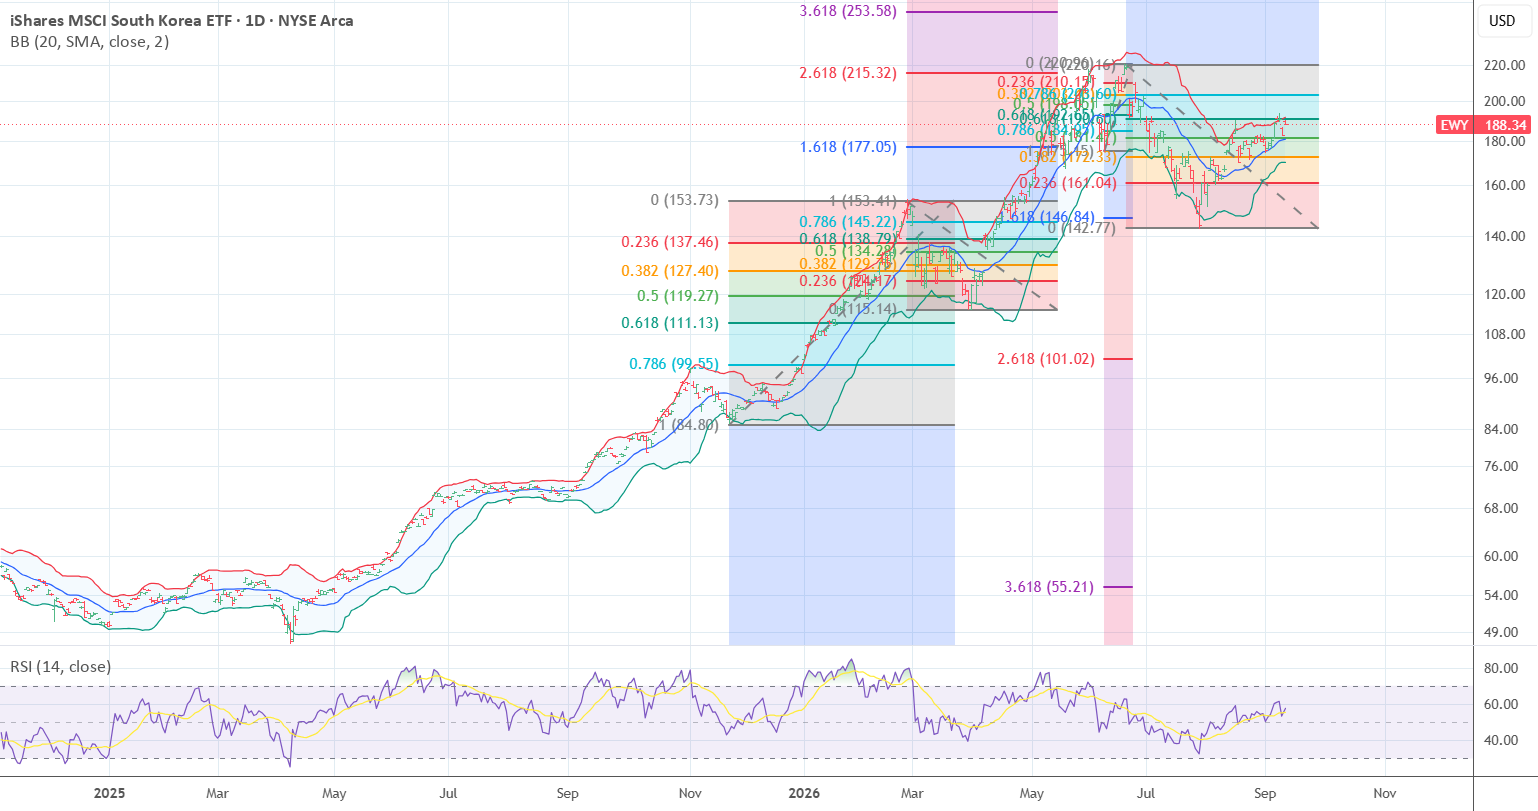
A TradingView user posting as wavetimer put up the EWY chart with a blunt read: it looks ready to roll over.
“I see the chart as ready to roll over”
What EWY actually tracks
EWY is the iShares MSCI South Korea ETF. It is the standard way US investors get exposure to Korean large caps, so it moves with Samsung, SK Hynix and the rest.
The C wave claim
In Elliott Wave theory, a C wave is the final leg down of a correction, and usually the deepest. Calling for a bigger C wave means expecting the decline to extend well past what has happened so far.
The contagion part
The bolder half of the post is not about Korea. It is the suggestion that a breakdown here drags global markets down with it.
“could bring the world markets with it !!”
Why chips are the link
The post is filed alongside SMH and SPY. Korea is a semiconductor economy, so a Korean equity slide reads as a signal about global chip demand and, from there, about US indexes.
Read it as an opinion
There is no price target, no timeline and no data beyond the chart, and TradingView states plainly that posts like this are not advice. Wave counts get revised constantly.
The big picture
This is one trader's Elliott Wave read on a single chart, not evidence. Treat the contagion claim as a hypothesis to watch, not a forecast to act on.