From TradingView · · 1m 30s
A textbook Bitcoin long that still hit the stop
A trader walked through every bullish signal on the BTC chart, then watched the trade close at a loss.
In brief
A trader walked through every bullish signal on the BTC chart, then watched the trade close at a loss. A setup can check every box on the checklist and still lose. That is why the stop loss is the only part of the plan you cannot skip. Originally reported by TradingView.
Bitcoin tests a demand zone
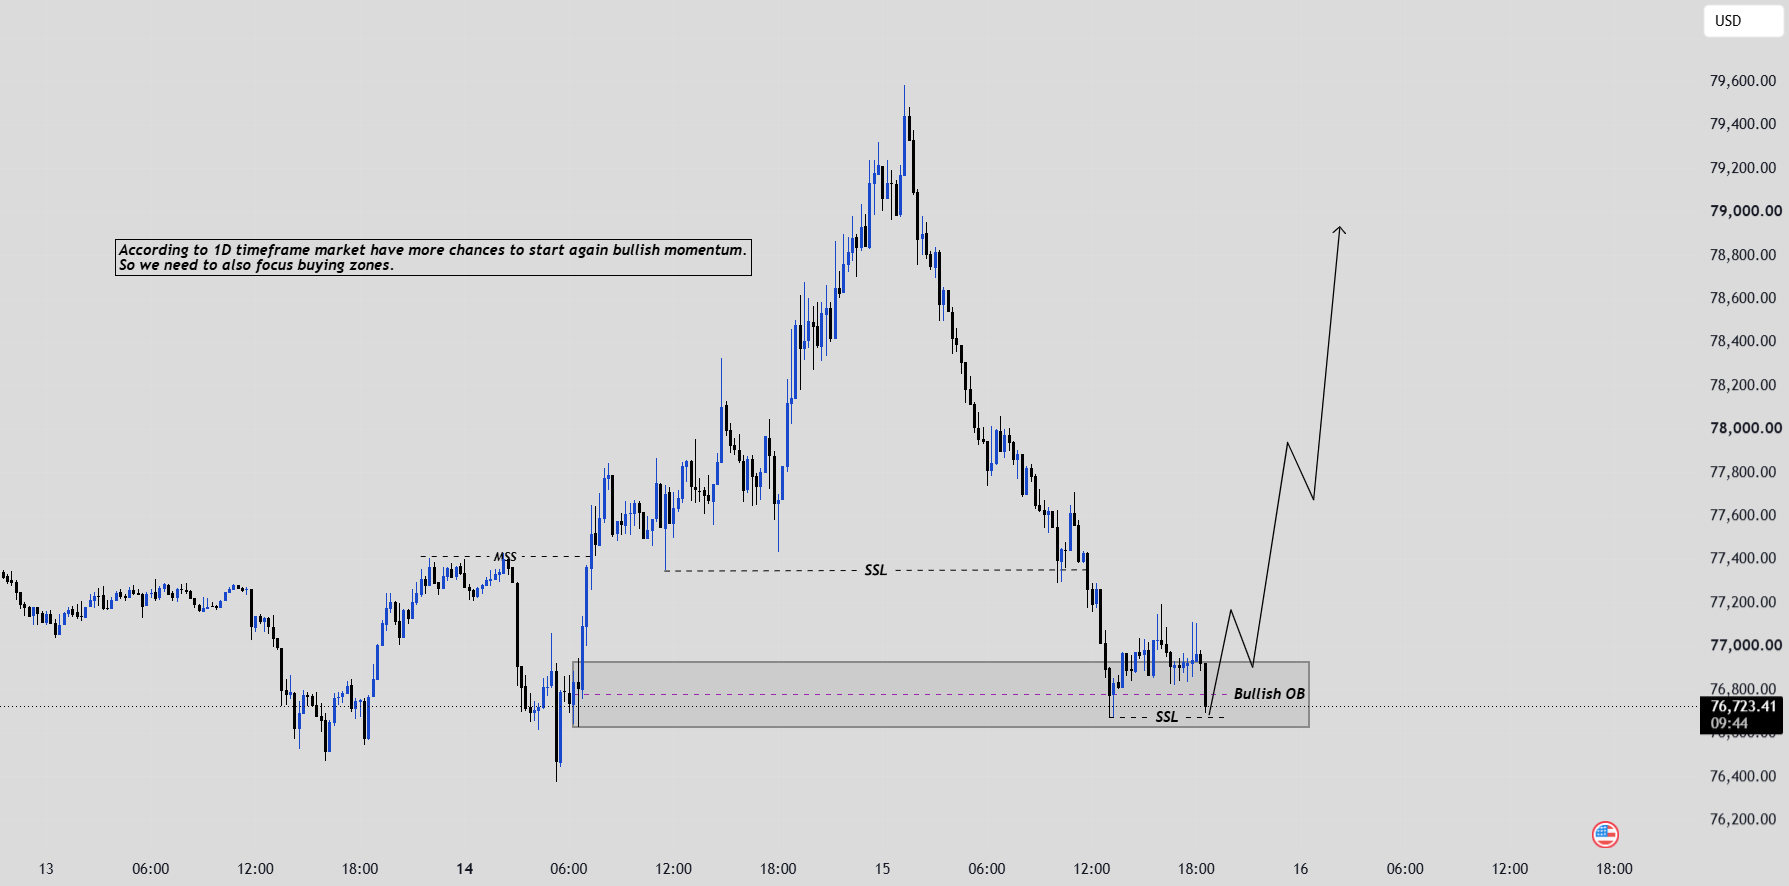
After a corrective move down, price arrives at an area where buyers stepped in before. PremiumTrader57 posts the whole read as an educational breakdown.
“Bitcoin is currently testing a key demand area after a corrective move.”
The daily chart leans long
The higher timeframe still points up, which is the permission slip for taking buys on smaller timeframes. Without that, a long here would be fighting the trend.
“the market has higher chances of resuming bullish momentum”
Character changed earlier
A market structure shift is marked further back on the chart, the moment sellers lost control. Everything after it is read as a pullback inside an uptrend, not a new downtrend.
Stops below got swept
Multiple sell-side liquidity levels were taken out, meaning price dipped just far enough to trigger resting sell orders. That flush often comes right before a push higher.
“Multiple SSL levels have been swept, which often precedes a reversal higher.”
The zone: 76,600 to 76,900
That grey band is the bullish order block, and price is reacting from it live. Stop sits below 76,400, targets at 77,800 and then 78,800 to 79,000.
“Risk : Reward ≈ 1 : 2.5”
Then the stop was hit
Forty-three minutes after posting, the update reads "Trade closed: stop reached." Every signal lined up, the trade lost anyway, and the risk cap did its job.
“Always manage your risk properly.”
The one thing
A setup can check every box on the checklist and still lose. That is why the stop loss is the only part of the plan you cannot skip.