From TradingView · · 1m 20s
A triangle setup on KAVA, waiting for Wave E
A 12-hour chart trader lays out the green zone buy, the targets, and the line that kills the whole idea.
In brief
A 12-hour chart trader lays out the green zone buy, the targets, and the line that kills the whole idea. The entry only exists if Wave E drops into the green demand zone and price action confirms it, and a daily close below invalidation cancels the trade. Originally reported by TradingView.
Price is boxed in

KAVA on the 12-hour chart is moving inside a triangle structure, the kind of squeeze that usually resolves with a sharp move out.
“Price appears to be trading within a triangle structure”
Wave D looks done
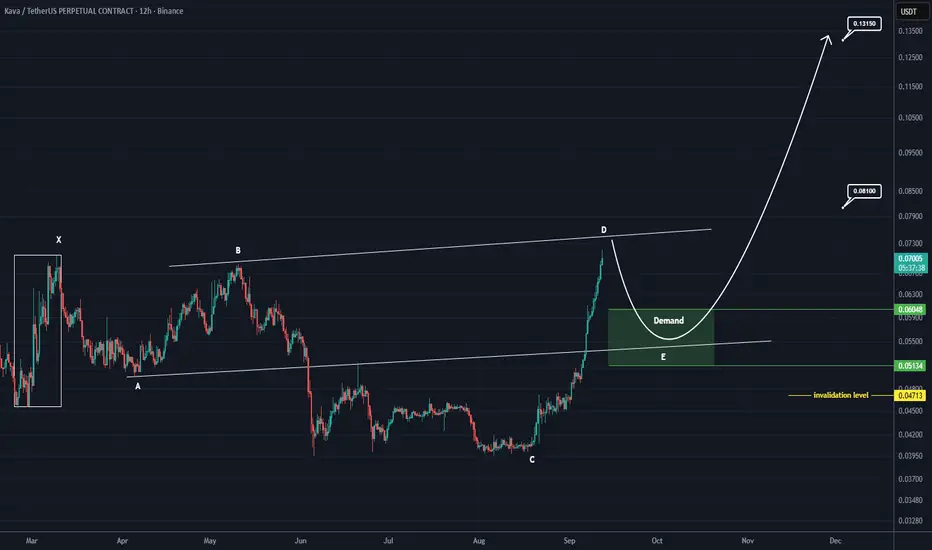
The count says Wave D has finished, which puts the next leg, Wave E, on deck as the move that sets up the trade.
“Wave D seems to have completed”
The green zone is the trigger
If Wave E retraces back into the marked green area, that becomes the spot to look for a buy. No retrace, no setup.
“If Wave E retraces back into the green zone, we can start looking for a potential spot buy position”
Demand, not a guarantee
The green band marks key demand where buyers are expected to step in, but the entry still needs price action to confirm it before any money moves.
“provided that price action confirms the setup”
Targets are already drawn
Upside levels sit marked on the chart rather than being invented after entry, and the structure gets watched as price develops.
“The target levels are clearly marked on the chart”
One candle kills it
A daily close below the invalidation level cancels the bullish scenario outright. That single line is the difference between a plan and a hope.
“A daily candle close below the invalidation level would invalidate this analysis”
The main idea
The entry only exists if Wave E drops into the green demand zone and price action confirms it, and a daily close below invalidation cancels the trade.