From TradingView · · 1m
Angled Trendline Grids for BTC
How angled trendlines predict Bitcoin support and resistance levels.
In brief
How angled trendlines predict Bitcoin support and resistance levels. Bitcoin price tests a grid line that could target the next level up or reverse downward. Originally reported by TradingView.
Why angled trendlines work
Horizontal levels stay fixed but markets trend. Angled lines from history give more precise support and resistance than flat levels.
Set up the chart
Use logarithmic scale for long-term growth and high timeframe like daily or weekly for major pivots.
Draw base trendline

Connect two major historical swing lows with a line that has several touches for valid slope.
Define unit channel
Draw a parallel line through a major high to create unit width between base trendline and this line.
Project grid with fibonacci
Use fibonacci extensions to project unit width up and down for angled bands that rise over time.
Add secondary pivots
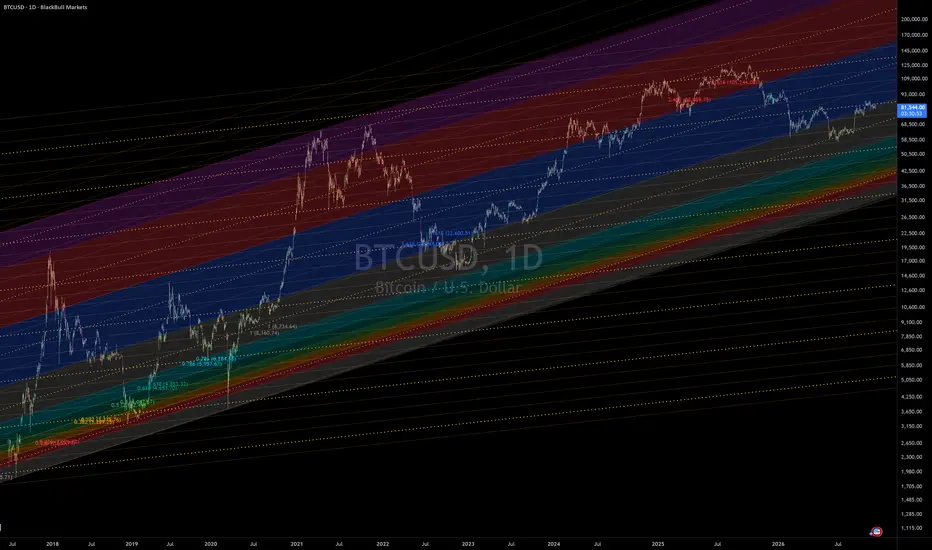
Mark midlines of each band as dotted lines where price often pauses or reverses before reaching band edges.
The key point
Bitcoin price tests a grid line that could target the next level up or reverse downward.