From TradingView · · 1m 20s
AUD/USD shows bearish reversal signals
A head and shoulders pattern combined with RSI divergence suggests the Australian dollar could weaken against the US dollar.
In brief
A head and shoulders pattern combined with RSI divergence suggests the Australian dollar could weaken against the US dollar. AUD/USD is forming a bearish head and shoulders pattern with RSI divergence, signaling potential weakness if price breaks below the 0.6866 neckline. Originally reported by TradingView.
Head and shoulders forming on AUD/USD
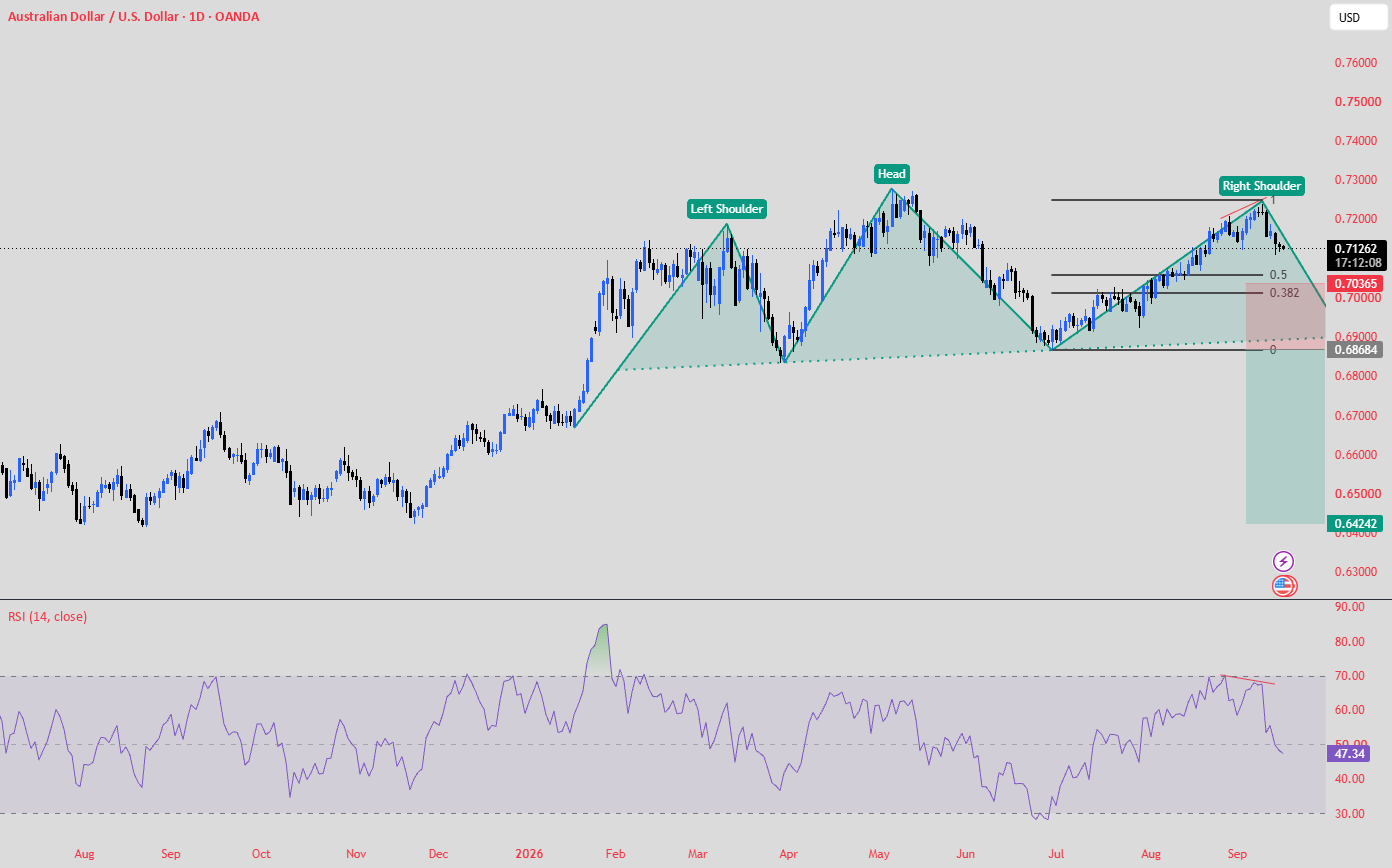
The daily chart shows a bearish head and shoulders pattern with the left shoulder at 0.715-0.718, head at 0.727-0.729, and right shoulder currently forming around 0.722-0.724.
RSI divergence confirms weakness
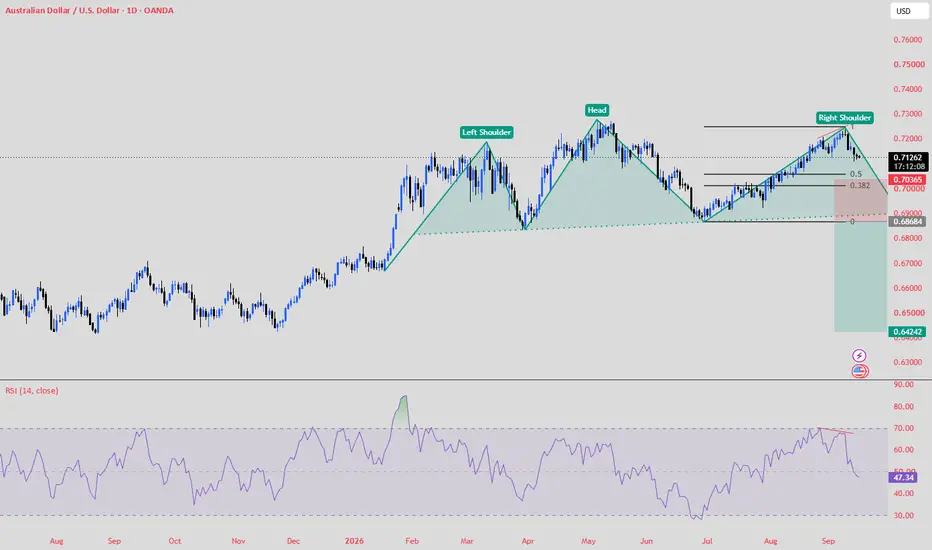
Price made a higher high but the RSI indicator failed to confirm it, showing bearish divergence and indicating weakening bullish momentum.
“price made a higher high but RSI failed to confirm the new high, indicating weakening bullish momentum”
Fibonacci zone offers resistance
AUD/USD is trading in the 0.382 to 0.50 Fibonacci retracement zone, an important area where price could face rejection.
Fed announcement could trigger move
A hawkish Federal Reserve outcome at today's FOMC event could increase US dollar demand and add downward pressure to AUD/USD.
Confirmation needs neckline break
Bearish confirmation requires a break and daily close below the 0.6866 neckline, with initial targets at 0.65 and 0.642-0.646.
Pattern invalidates on higher move
A sustained move above the right shoulder and head structure would weaken or invalidate the bearish head and shoulders thesis.
The bottom line
AUD/USD is forming a bearish head and shoulders pattern with RSI divergence, signaling potential weakness if price breaks below the 0.6866 neckline.