From TradingView · · 1m
AUD/USD shows bullish signals at key support level
Trader spots higher highs and higher lows pattern with bullish engulfing candle at area of interest on 4-hour chart.
In brief
Trader spots higher highs and higher lows pattern with bullish engulfing candle at area of interest on 4-hour chart. The AUD/USD pair is showing a bullish trend with higher lows and higher highs, confirmed by a bullish engulfing pattern at a key support zone. Originally reported by TradingView.
Bullish trend structure forming
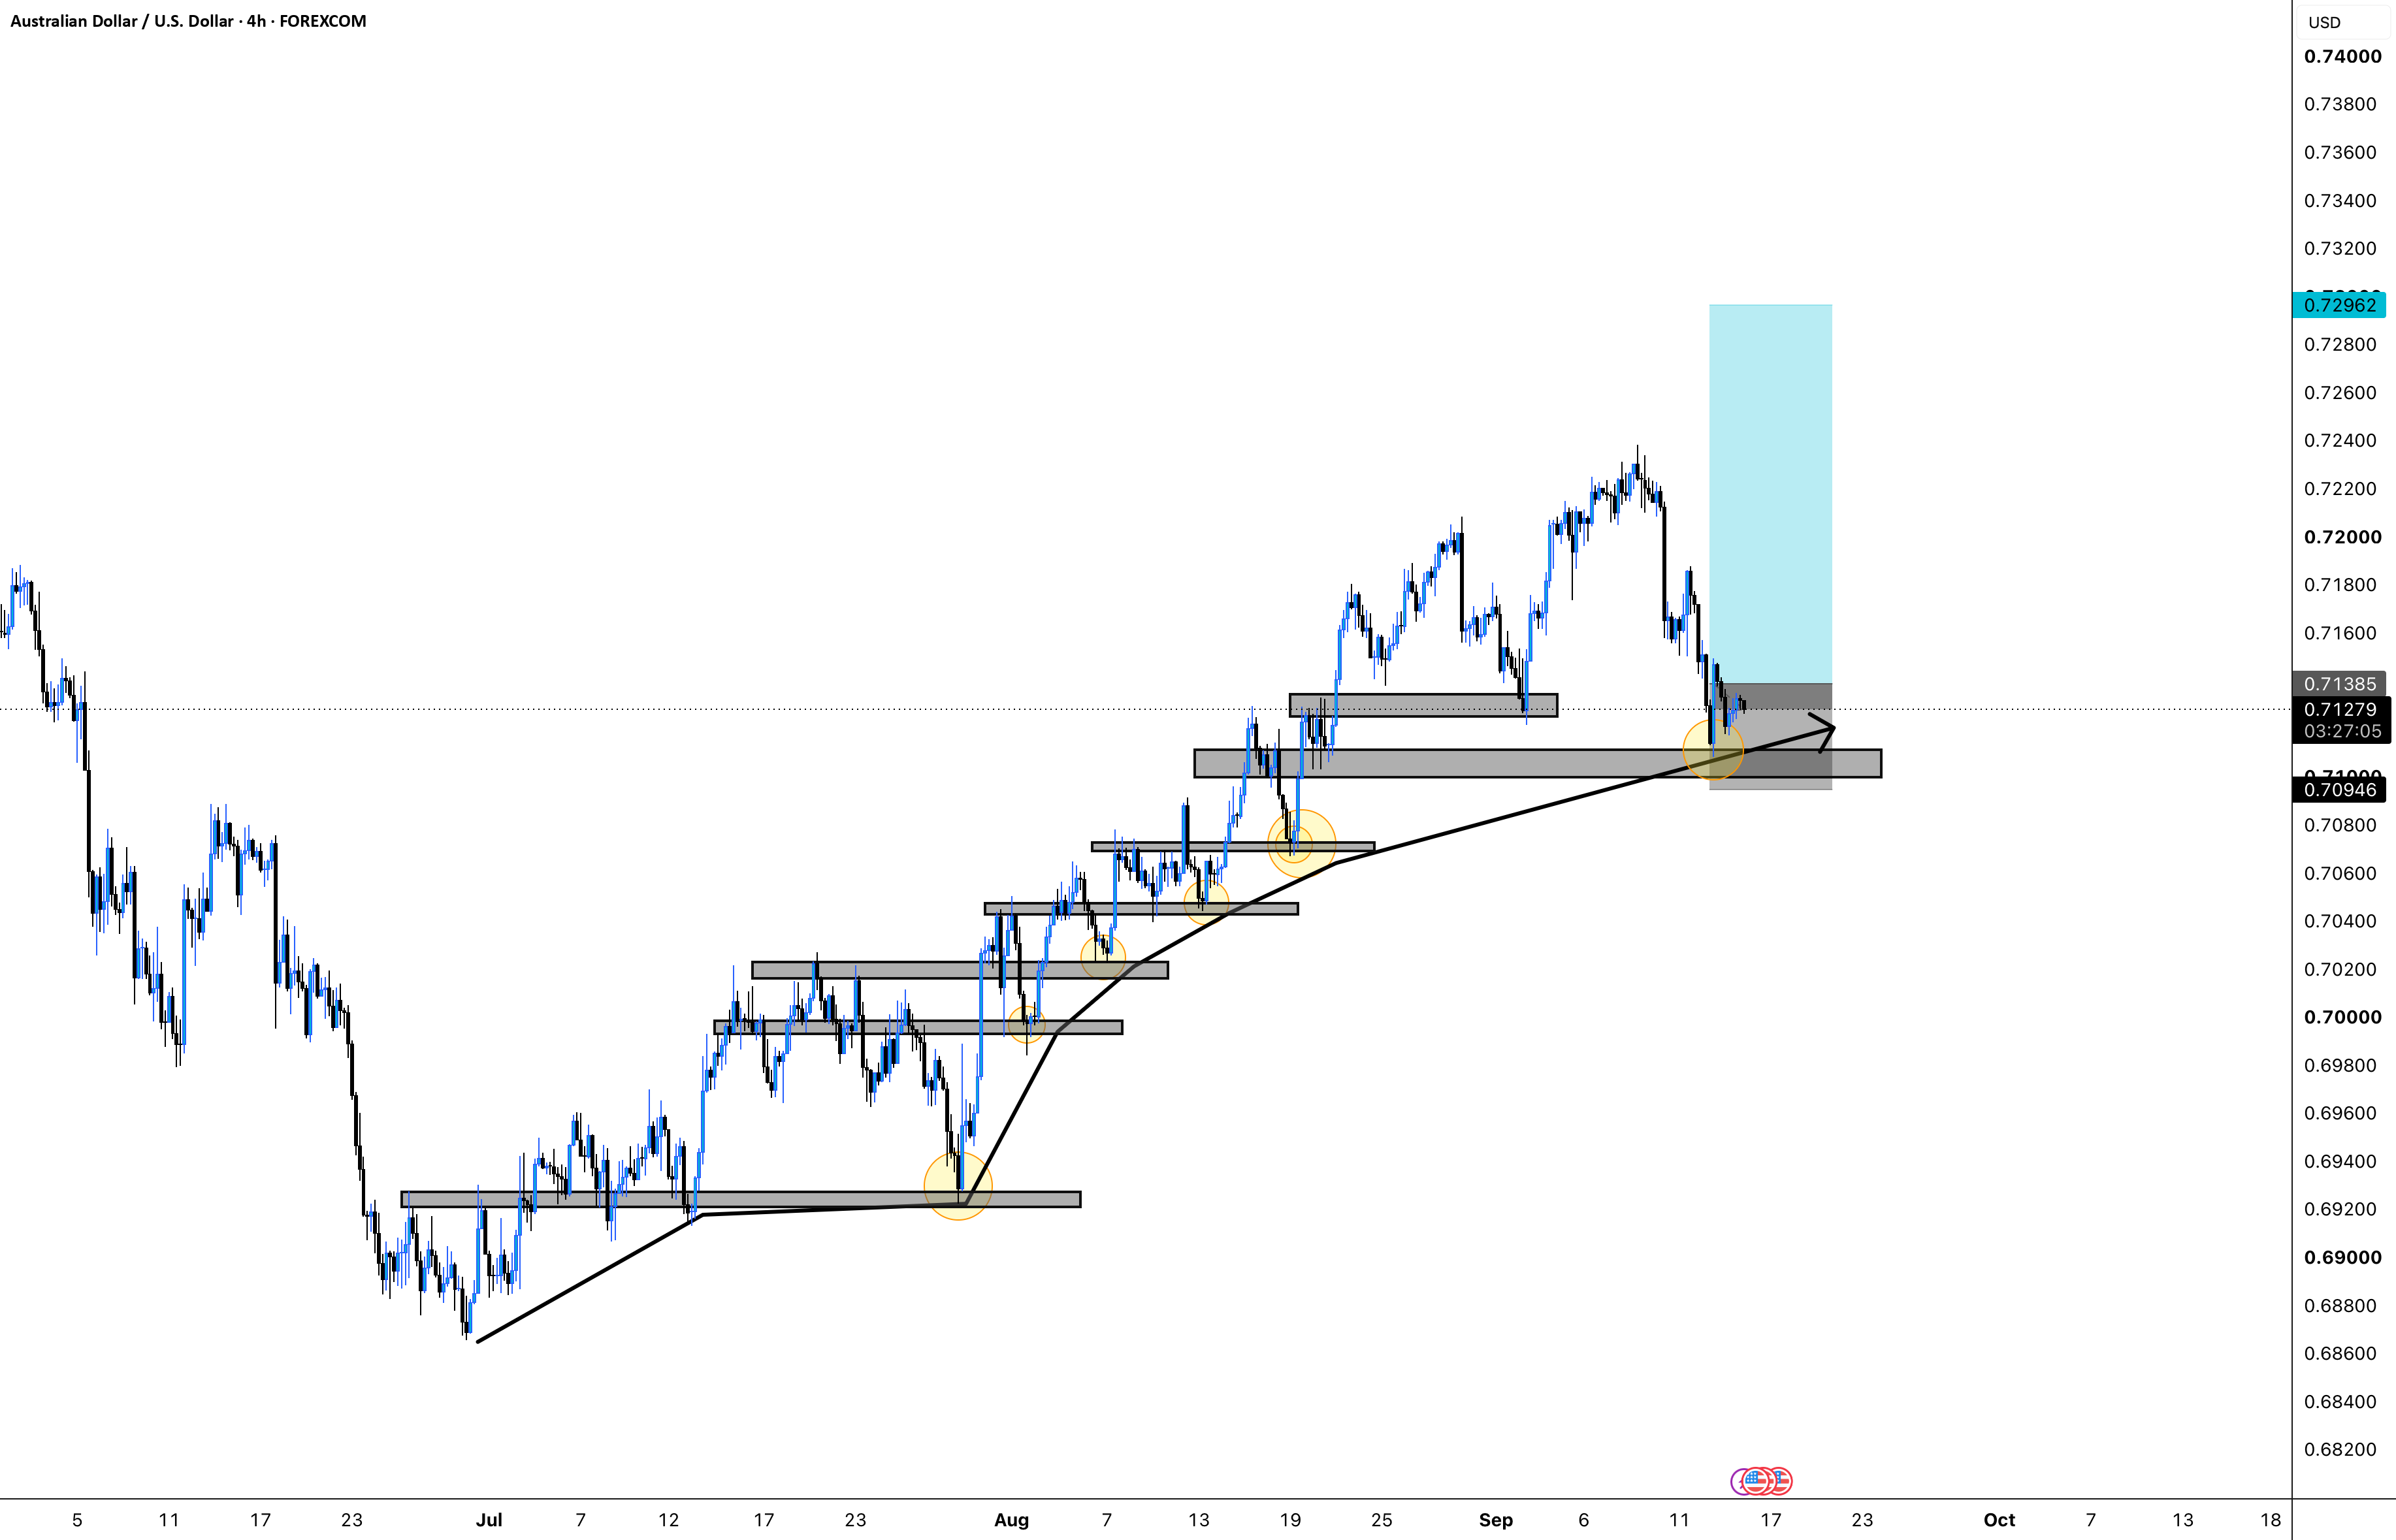
The AUD/USD pair is making higher highs and higher lows, the classic signature of an uptrend in technical analysis.
Price reaches area of interest
The currency pair has pulled back to a key support zone on the 4-hour timeframe, a level traders are watching closely.
Bullish engulfing pattern appears
A bullish engulfing candle has formed at the area of interest, suggesting buyers are stepping in at this support level.
“price has now came to AOI on 4hr and bullish engulfing”
Long position signal
The combination of trend structure, support zone, and candlestick pattern creates a potential buying opportunity for the Australian dollar.
Technical setup aligns
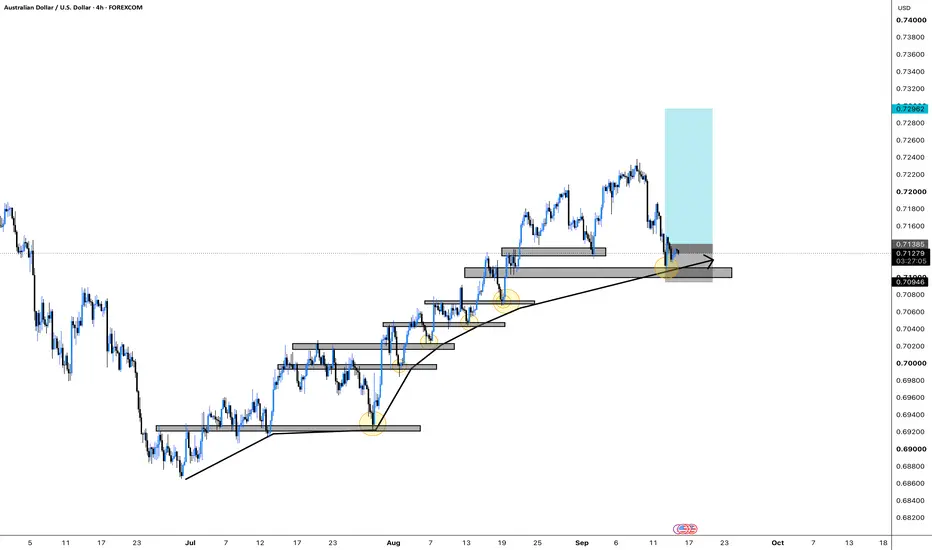
Multiple technical factors are converging: uptrend intact, price at support, and bullish reversal pattern confirmed.
“Bullish trend HL & HH”
What matters most
The AUD/USD pair is showing a bullish trend with higher lows and higher highs, confirmed by a bullish engulfing pattern at a key support zone.