From TradingView · · 1m 20s
BERA is pressing against its ceiling
A daily chart setup where one confirmed break opens a ladder of six upside targets.
In brief
A daily chart setup where one confirmed break opens a ladder of six upside targets. Wait for the confirmed break above resistance and the SMA100. Without confirmation, there is no trade, only a hope. Originally reported by TradingView.
Watch the daily chart
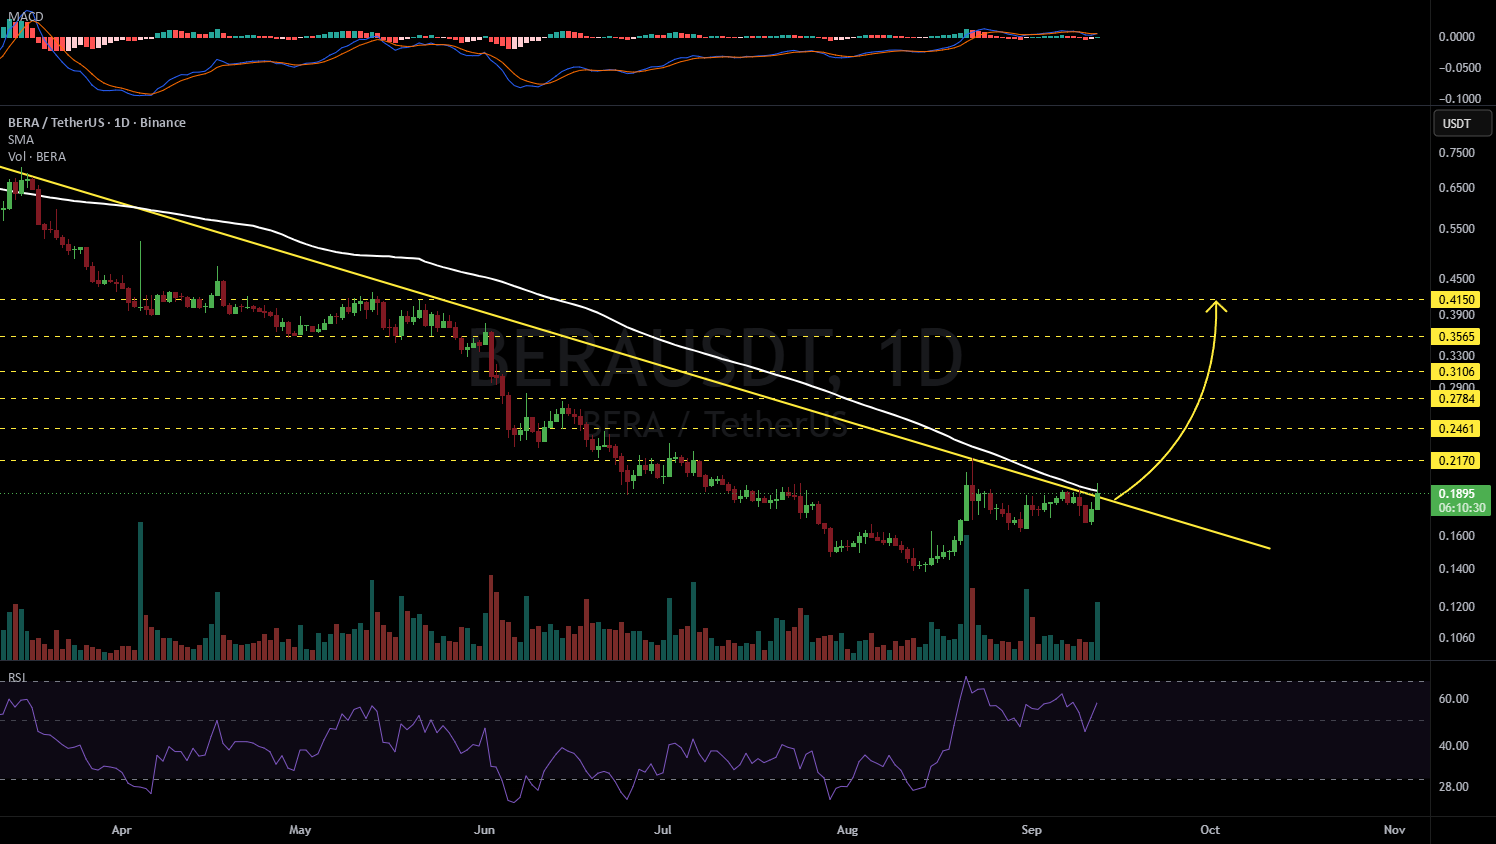
BERA/USDT on Binance is the setup in question, viewed on the 1D timeframe. The action worth tracking is happening right now, not on a lower timeframe.
“Keep an eye on the #BERA daily chart.”
Two lids at once
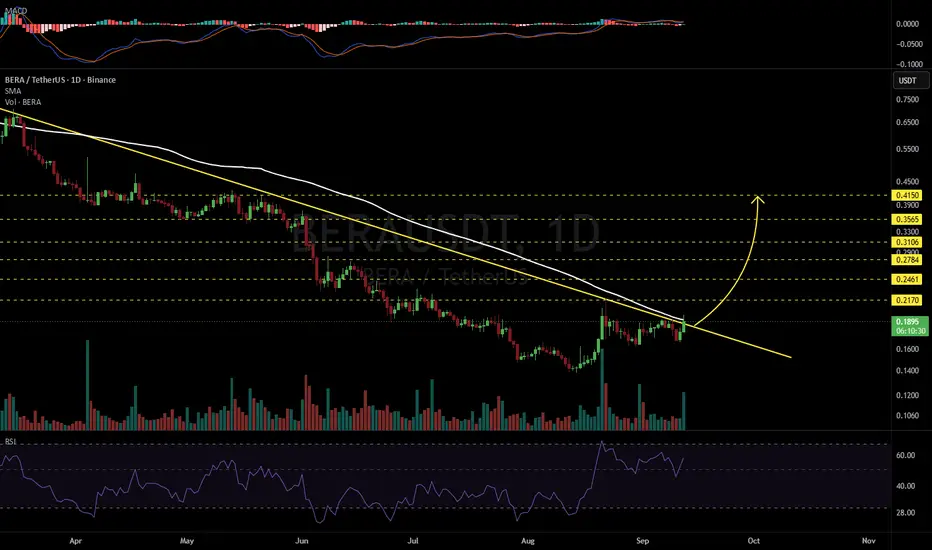
Price is squeezed under a descending resistance line and the SMA100 at the same time. Both have to give way for the move to matter.
“It is on the verge of breaking out above the descending resistance and the SMA100.”
Confirmation comes first
The whole thesis is conditional. Nothing on the target list applies unless the breakout is confirmed, not just poked at intraday.
“In case of a confirmed breakout, the potential upside targets are:”
The first three targets
$0.2170, then $0.2461, then $0.2784. These are the near steps, the ones a breakout would reach first if buyers hold the line.
The stretch targets
Past the first cluster sit $0.3106, $0.3565 and $0.4150. The top of that ladder is roughly double the first target.
Tight stop, always
The setup carries an explicit warning attached: size the position and place the stop before entering. A ladder of targets means nothing without a floor under the loss.
“Always remember to use a tight stop-loss and maintain proper risk management.”
The short version
Wait for the confirmed break above resistance and the SMA100. Without confirmation, there is no trade, only a hope.