From TradingView · · 50s
Bitcoin chart analysis for BYBIT:BTCUSD.P
Bitcoin Guide's 30-minute chart analysis shows long position strategy at $82,196.6.
In brief
Bitcoin Guide's 30-minute chart analysis shows long position strategy at $82,196.6. Bitcoin Guide's long position strategy at $82,196.6 targets $84,334 with stop-loss below purple support line. Originally reported by TradingView.
October 19 Bitcoin chart analysis
Bitcoin Guide's 30-minute chart analysis shows long position strategy at $82,196.6.
Long position strategy
Entry at $82,652.4 with stop-loss below purple support line for bullish trend.
First target level

First target at $84,334 with $83,700 as re-entry zone for long positions.
Zone 2 strategy
Entry at $81,442.3 with stop-loss below green support line for sideways movement.
Price action update
Price failed to touch purple zone, broke support line, now moving sideways at $81,442.3.
Trade closed
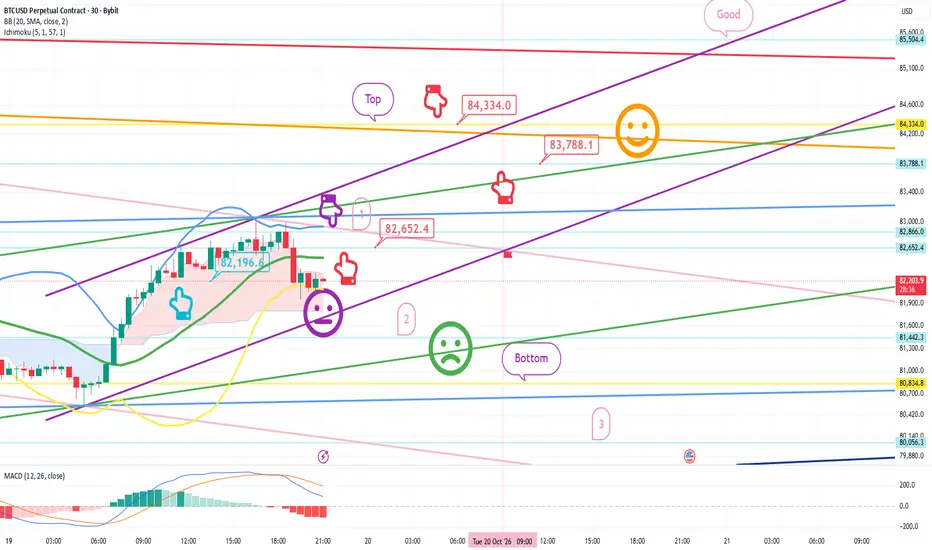
Target reached at $84,334 with stop-loss below purple support line.
The main idea
Bitcoin Guide's long position strategy at $82,196.6 targets $84,334 with stop-loss below purple support line.