From TradingView · · 1m 20s
Bitcoin Long-Term Analysis: Simple Chart Strategy
Bitcoin analysis uses two trendlines and Fibonacci retracement to build a simple long-term plan without predictions.
In brief
Bitcoin analysis uses two trendlines and Fibonacci retracement to build a simple long-term plan without predictions. Bitcoin traders can prepare for market corrections using predefined Fibonacci levels without relying on others' predictions. Originally reported by TradingView.
Bitcoin Long-Term Analysis
Trading analysis doesn’t always need ten indicators, five different opinions and a chart full of signals.
Start With the Bigger Picture
For a long-term Bitcoin analysis, I prefer looking at the market on a logarithmic chart.
Add Fibonacci Retracement
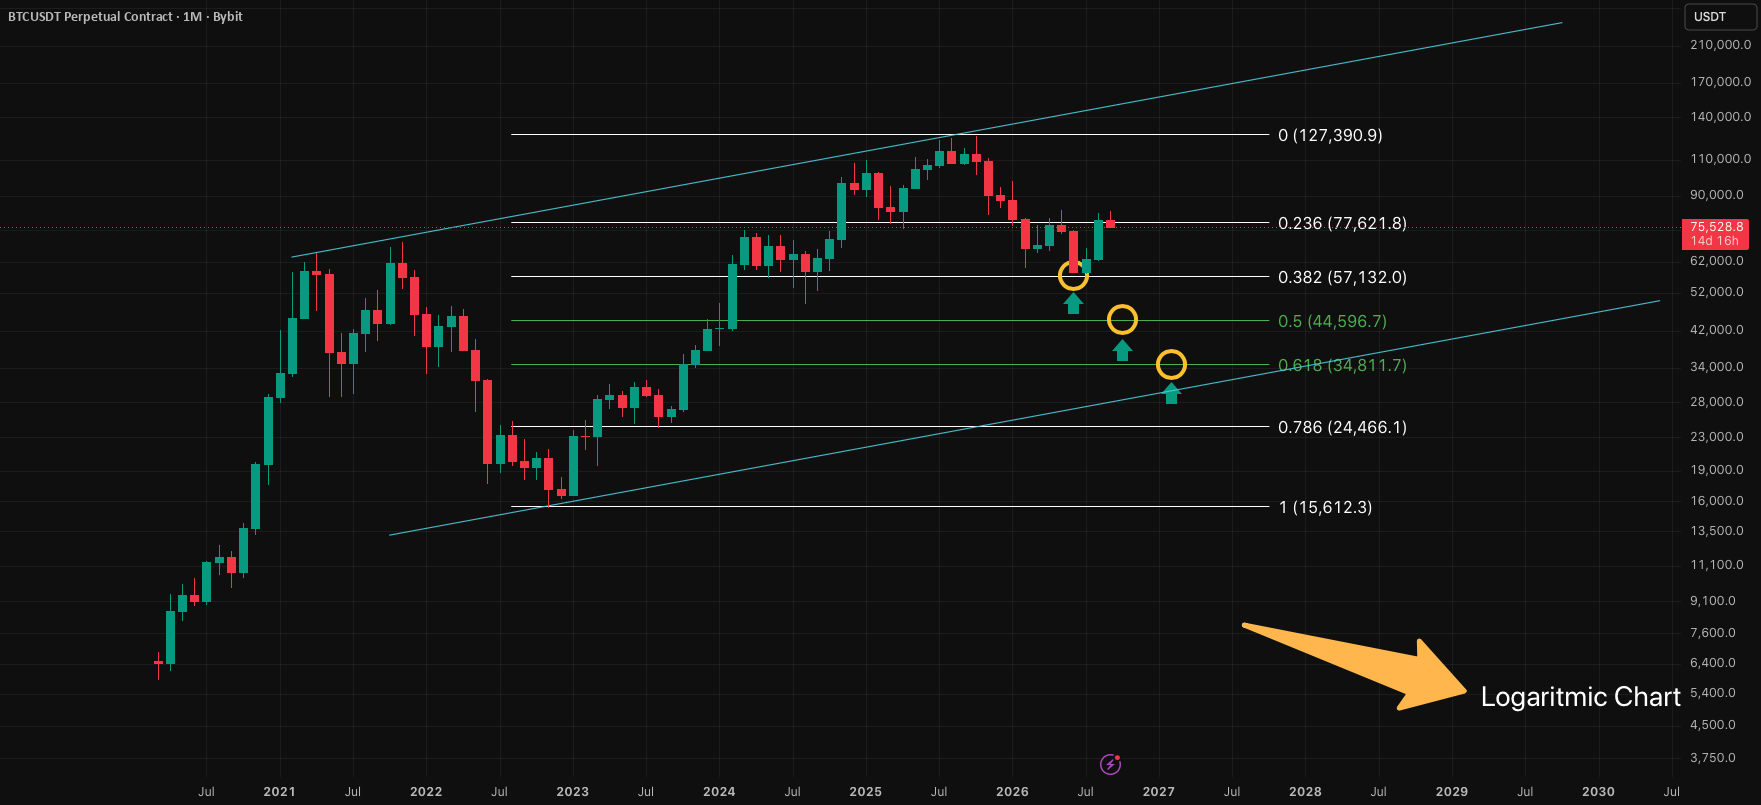
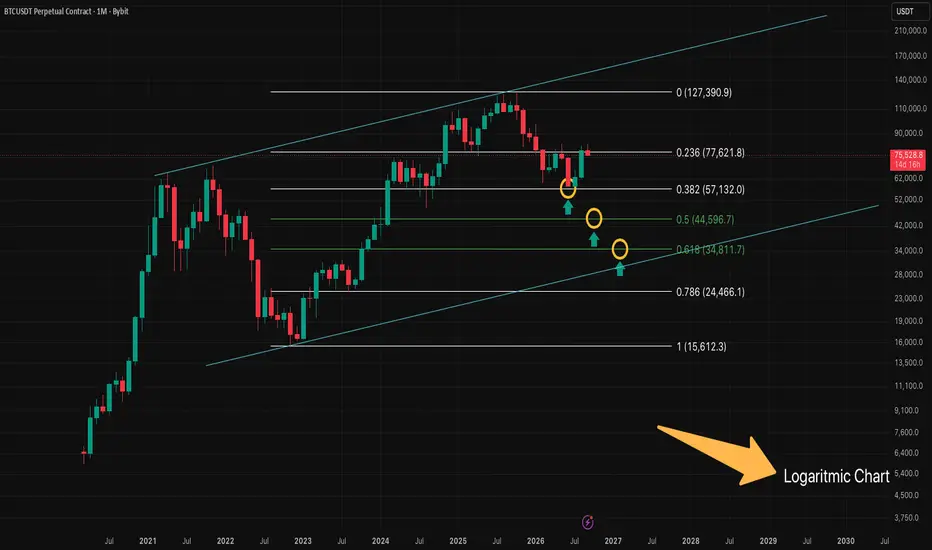
This gives us several important areas to watch: 0.236, around $77,622 0.382, around $57,132 0.500, around $44,597 0.618, around $34,812 0.786, around $24,466.
Don’t Ignore the 0.236 Level
A relatively shallow retracement on such a large timeframe can still represent an important area in the broader structure.
The Levels Are a Plan, Not a Prediction
If Bitcoin continues higher, you participate in that move. If Bitcoin enters a larger correction, you already know which areas you want to watch.
A Falling Market Doesn’t Create Panic
Lower prices aren’t automatically buying opportunities. Market structure can change, support can fail and every level still needs reassessment.
Stop Looking for Someone Else’s Prediction
Learn how to build your own map using a logarithmic chart, two trendlines, and Fibonacci retracement levels.
The headline
Bitcoin traders can prepare for market corrections using predefined Fibonacci levels without relying on others' predictions.