From TradingView · · 1m 10s
Bitcoin Macro Elliott Wave Map: New Impulse or Corrective Rally
Bitcoin's price structure shows two possible futures: a new bullish push or a deeper correction ahead.
In brief
Bitcoin's price structure shows two possible futures: a new bullish push or a deeper correction ahead. Bitcoin's Elliott Wave analysis suggests a 70% chance of a new bullish impulse starting near $86,000 or a 30% chance of a corrective rally targeting $92,000 before a decline toward $45,000. Originally reported by…
Bitcoin's Price Structure
Bitcoin's higher-timeframe structure reached completion inside $125,000, $126,000 price-and-time confluence area.
Current Corrective Structure
The decline began October 5, 2025, developing into a five-swing corrective structure labeled A, B, C, D, E reaching $57,687.
Primary Count Scenario
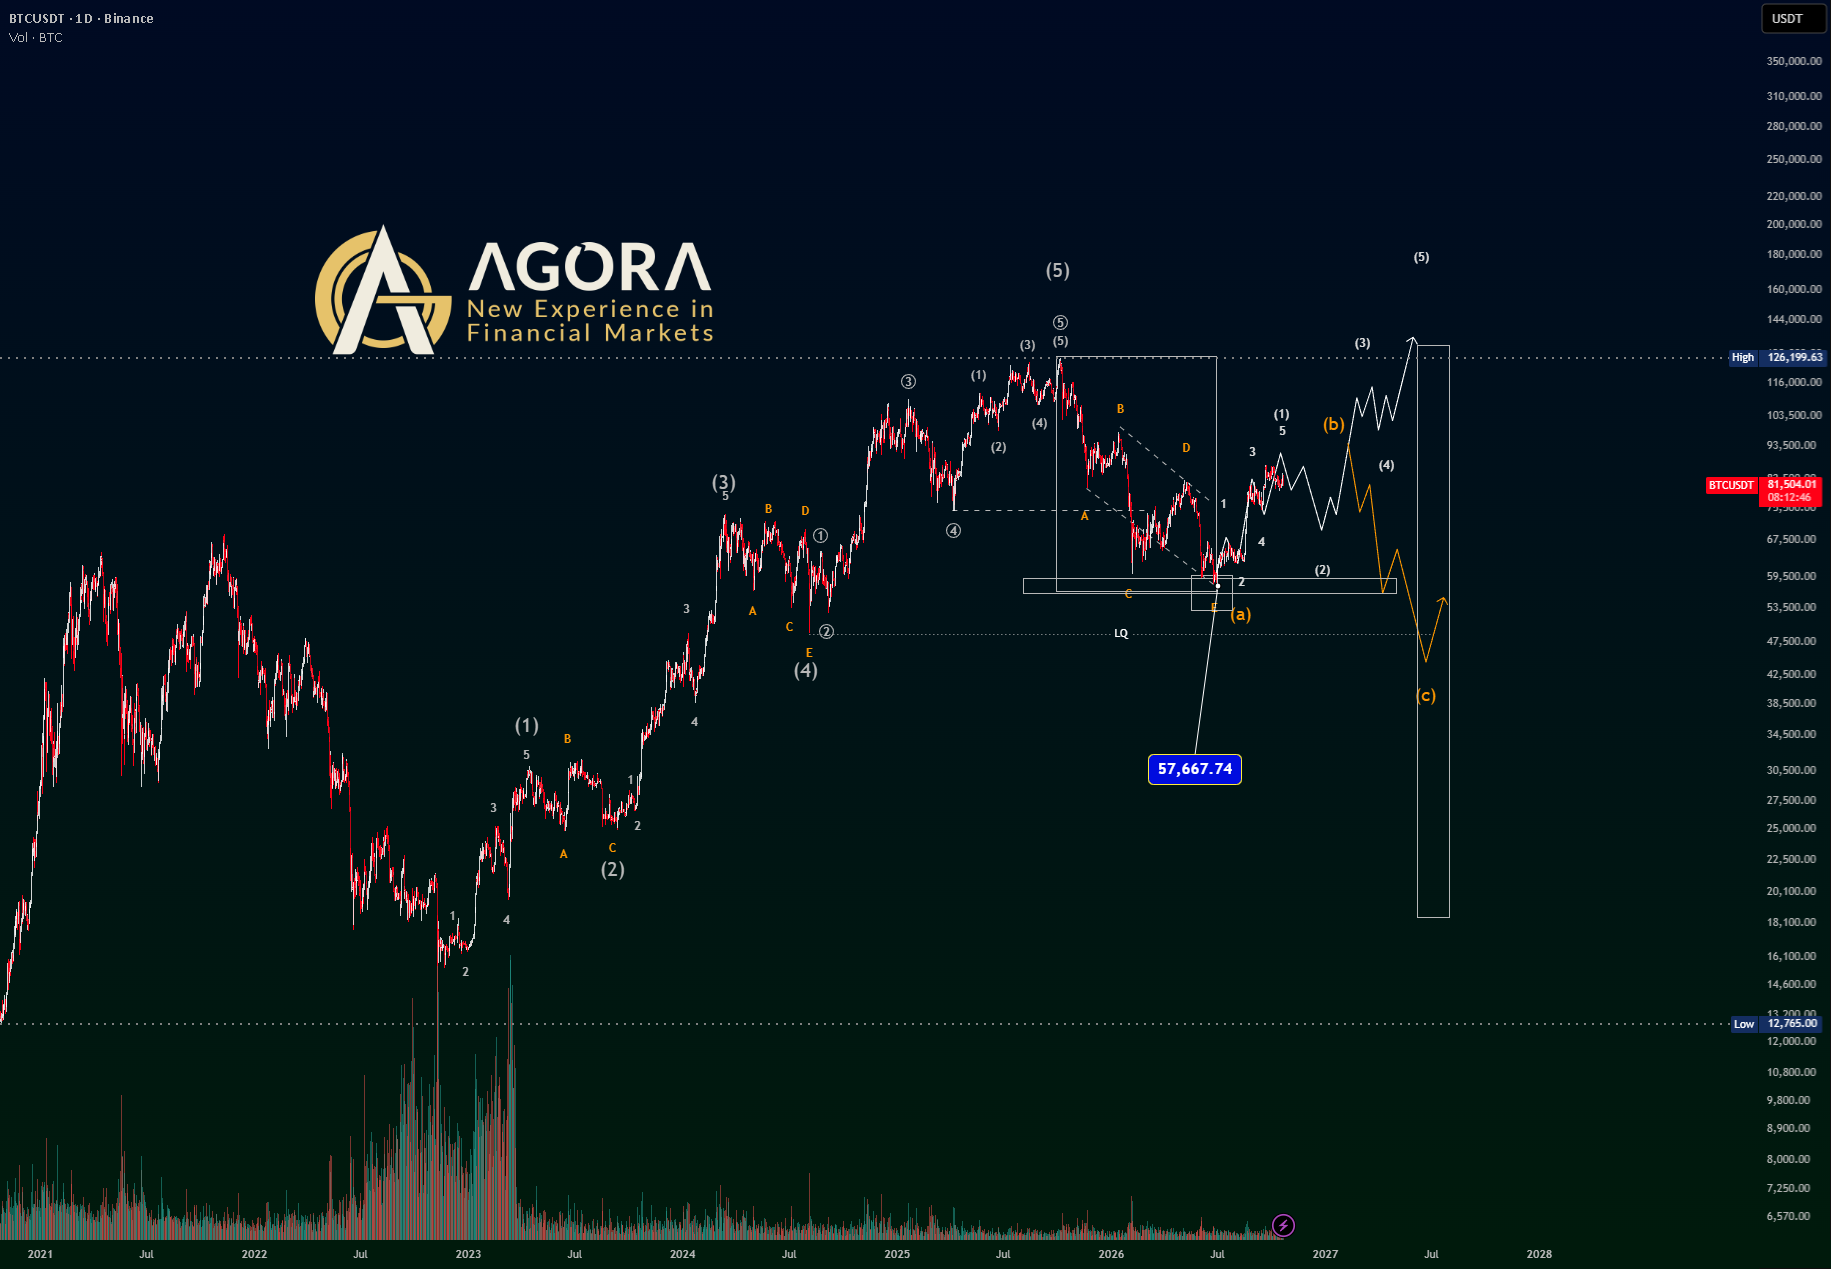
The white scenario suggests a new bullish impulse starting near $86,000 with a five-wave structure forming.
Alternative Count Scenario
The yellow scenario treats the move to $57,687 as part of a larger three-wave correction targeting $92,000 before a decline.
Probability Assessment
The author assigns 70% probability to the primary count and 30% to the alternative count based on current wave structure.
Key Validation Signals
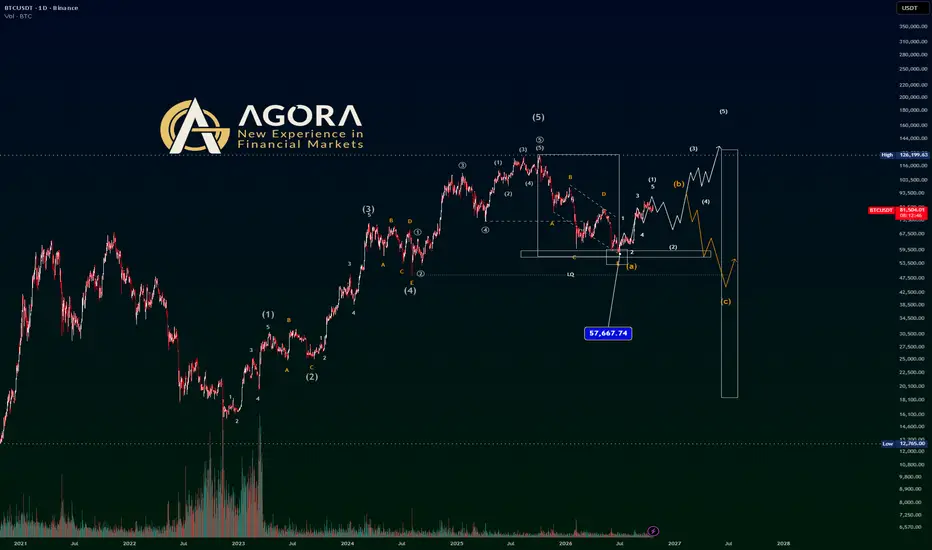
A decisive break below $57,687 would invalidate the new-impulse count while sustained acceptance below $56,351 confirms the correction remains unfinished.
The key point
Bitcoin's Elliott Wave analysis suggests a 70% chance of a new bullish impulse starting near $86,000 or a 30% chance of a corrective rally targeting $92,000 before a decline toward $45,000.