From TradingView · · 1m 20s
Bitcoin's fake breakout, and the case for $56K
A trader reverses his own bullish call after spotting a higher timeframe supply zone that changes everything.
In brief
A trader reverses his own bullish call after spotting a higher timeframe supply zone that changes everything. When a high timeframe supply zone sits above price, support levels below it stop being reliable floors. Originally reported by TradingView.
The old call is dead
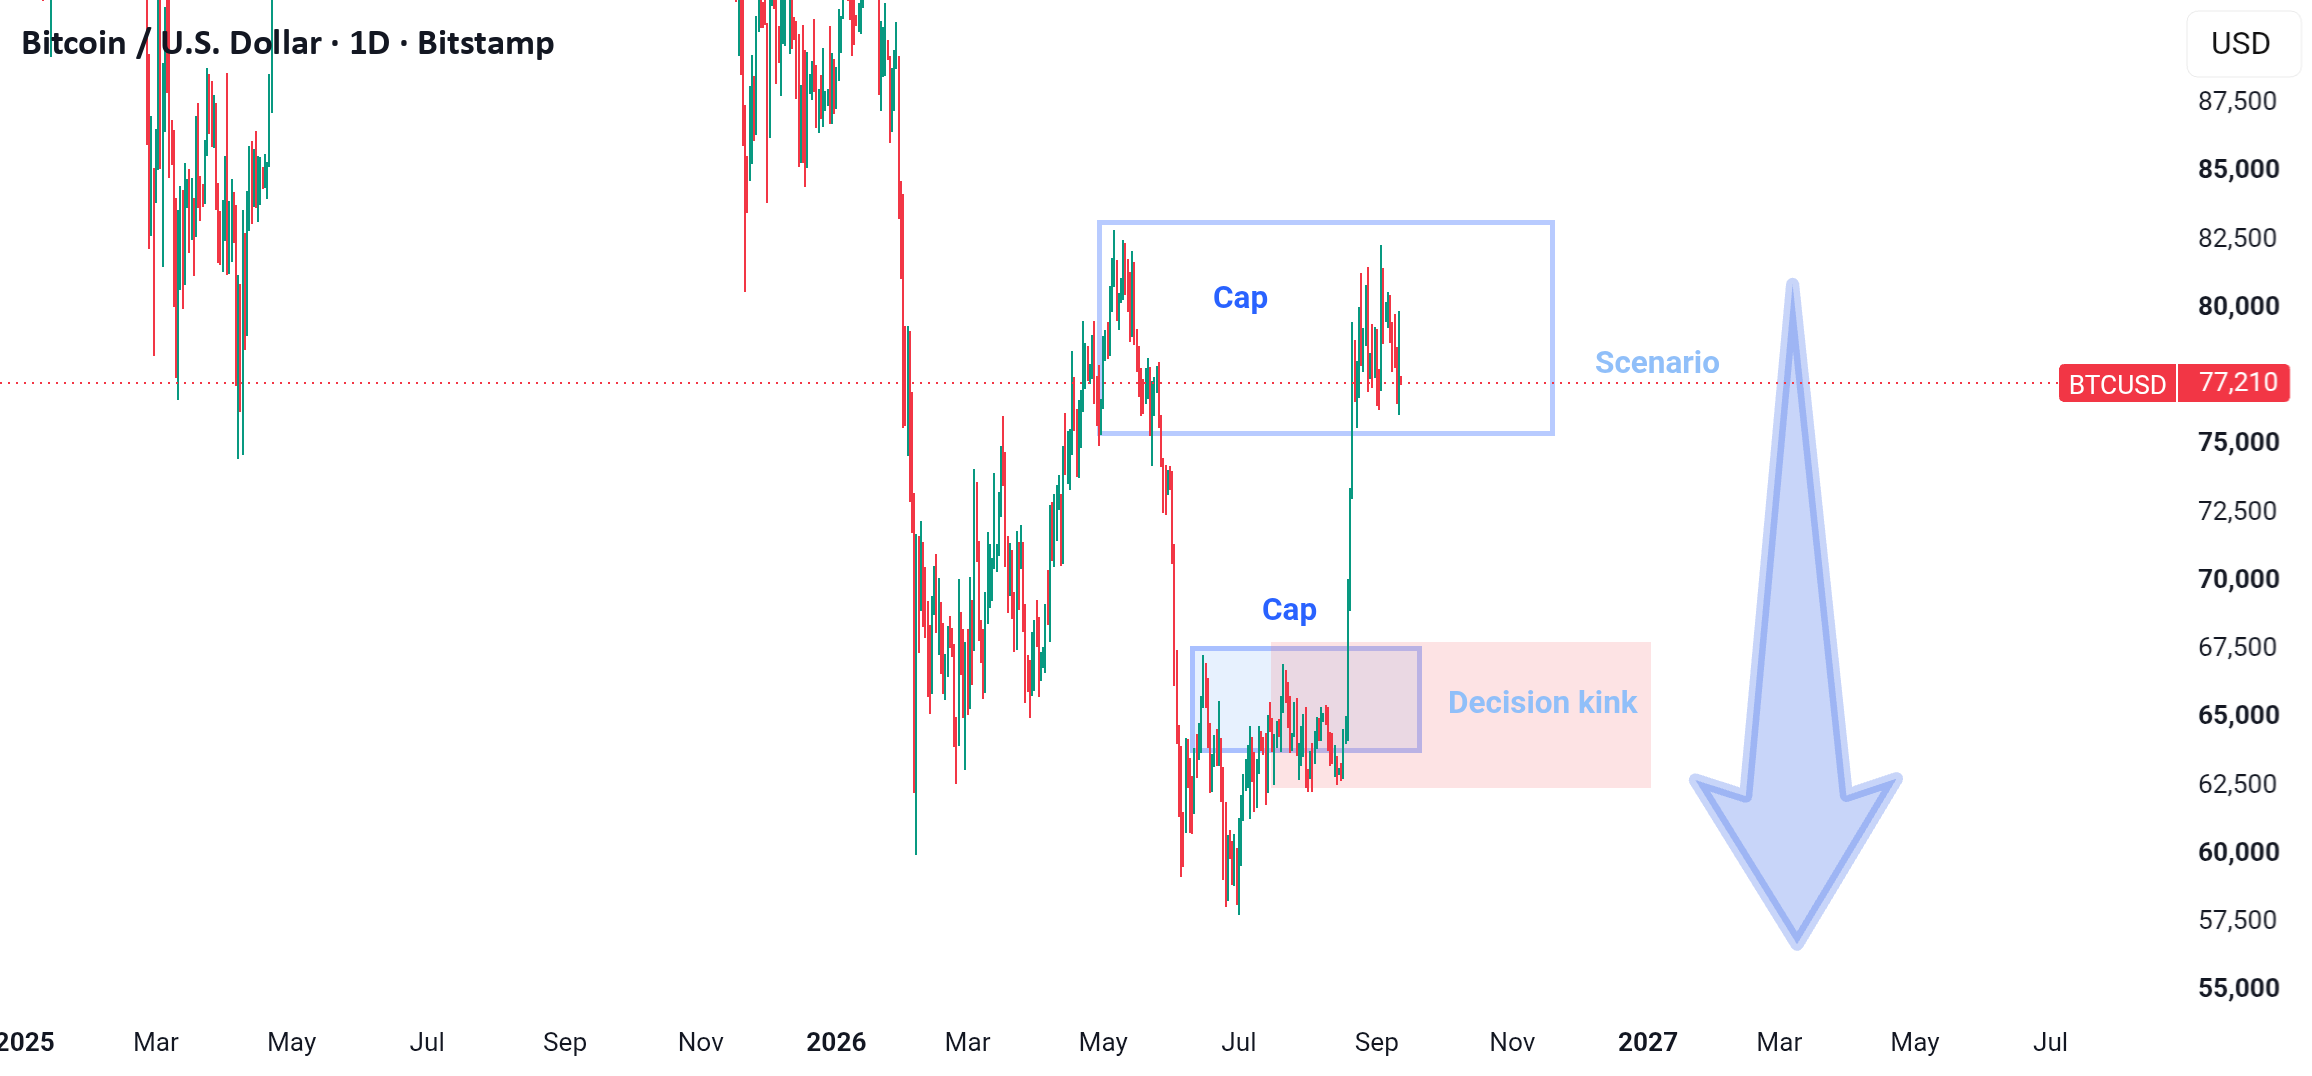
On September 6 the read was a dip into $64,000 to $68,000, a bounce, then back to the highs. A closer look at structure killed that scenario.
“a deeper re-evaluation of the price action and market structure indicates a critical shift in the primary scenario”
The Cap sits higher up
The Cap pattern near $76,000 to $82,000 turned out to belong to a higher timeframe, not the lower one it was first read on.
Bigger timeframe, bigger supply
Under RTM price action rules, a higher timeframe Cap carries far more selling weight than a lower timeframe one. That tips control to the big sellers.
“This structural dominance has swung the balance decisively in favor of high-timeframe sellers.”
The rally was bait
The push above prior highs was a fake-out, engineered to tap the heavy supply zone and sweep the liquidity resting above.
“merely a fake-out designed to penetrate the HTF Cap zone and sweep liquidity”
A double top confirms it
Right after touching that supply, price printed a double top. That is the structural reversal signal, and selling pressure started from there.
Support breaks, $56K next
The Decision Kink around $64,000 to $68,000 is now expected to snap rather than hold, with previous swing lows giving way toward $56,000 to $60,000.
“targeting a new low in the $56,000, $60,000 region”
Here's the gist
When a high timeframe supply zone sits above price, support levels below it stop being reliable floors.