From TradingView · · 1m 30s
BTC breaks down, and the target is 66.9K
A short call on BTC perpetuals after price cracked the Wave 4 floor, with CPI data lining up against the bulls.
In brief
A short call on BTC perpetuals after price cracked the Wave 4 floor, with CPI data lining up against the bulls. Losing the Wave 4 low flipped the read from bullish to bearish, and the next real support sits down at 66.9K to 70K. Originally reported by TradingView.
A short on BTC perps
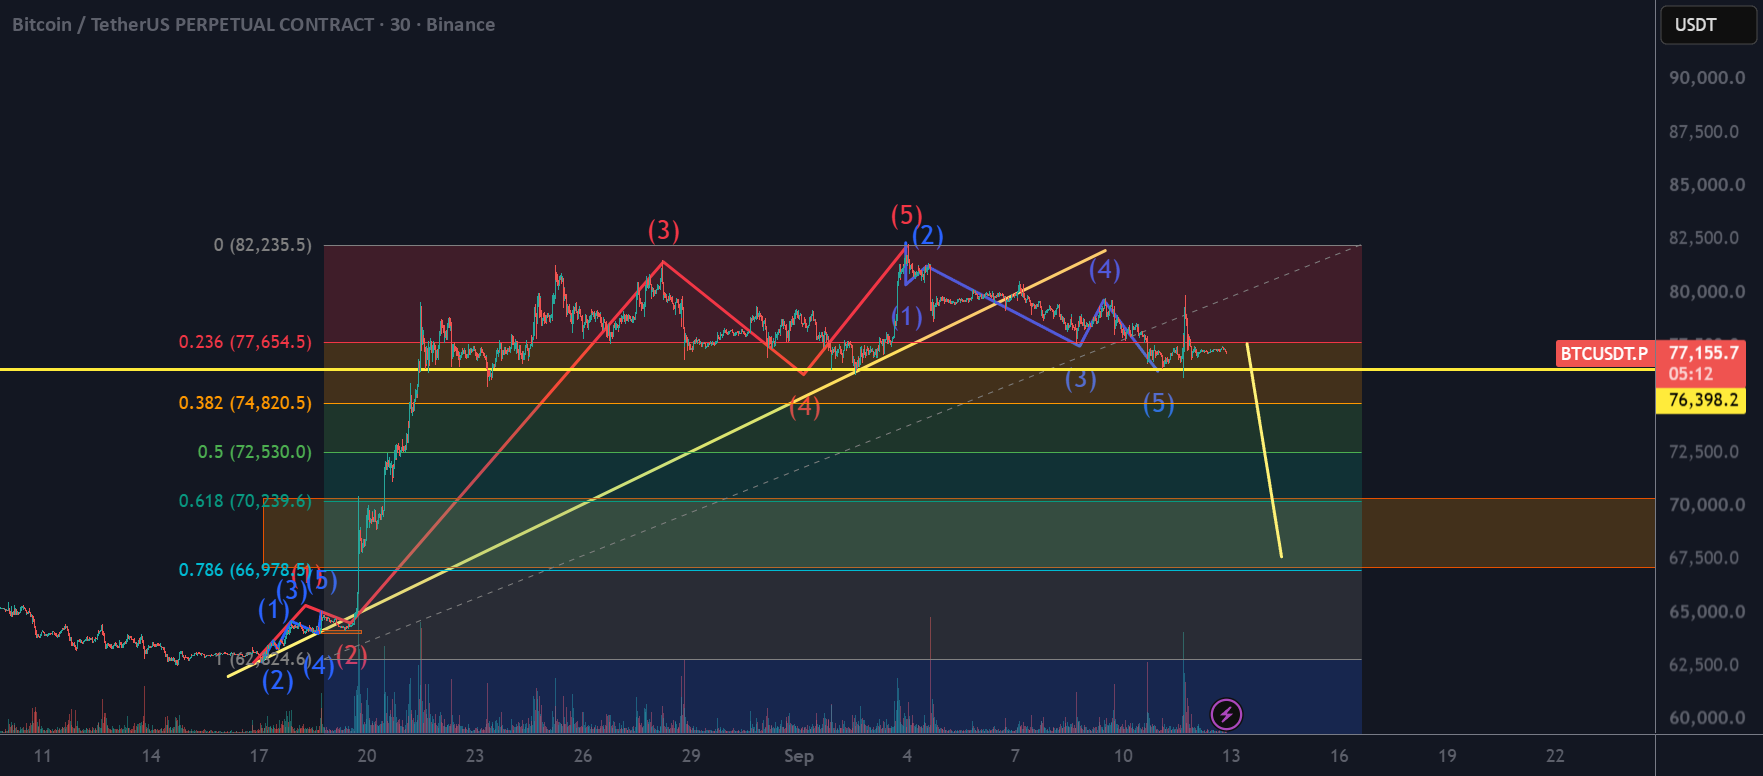
HabixGroup posted a short setup on the Bitcoin / TetherUS perpetual contract on Binance, published as a bearish call on the chart.
The Wave 4 floor gave way
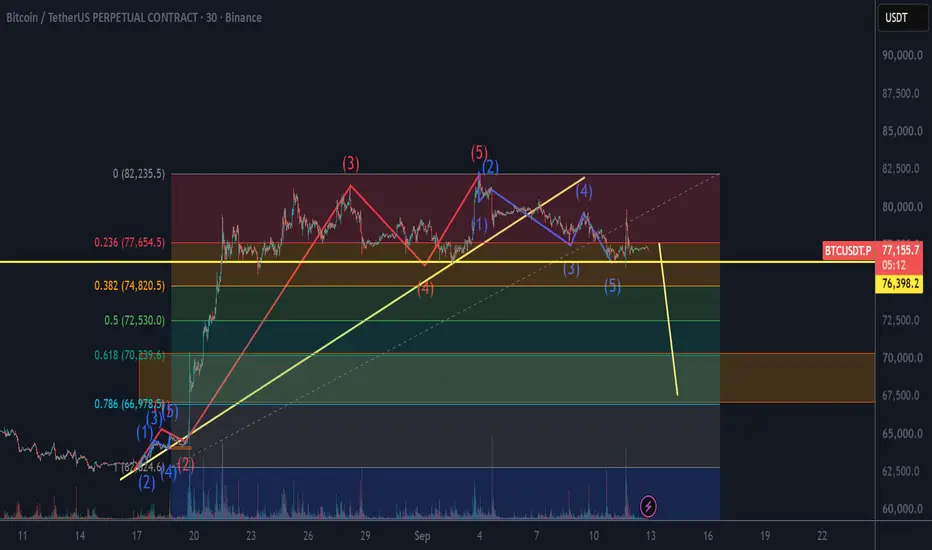
Price dropped under the bottom of Wave 4. That break is the whole argument, and it flips the chart from constructive to bearish.
“Price broke below Wave 4 bottom so looking more bearish than bullish now”
CPI stacks the odds down
Inflation data lands on top of the broken structure. With rate hikes expected, the chart and the macro point the same way.
“Coupled with CPI data most probable direction is down”
Support at 66.9K to 70K
If the bearish case plays out, that band is where the drop is expected to find a floor. It is the level to watch, not a stop level to ignore.
“expecting support around 66.9K - 70K in bearish scenario”
Or it is wave 1 of a new run
The same count leaves room for the other read: this leg is wave 1 of a fresh bullish trend, which makes the 66.9K zone a buy area rather than a breakdown.
“Assuming this is wave 1 of a new bullish trend”
Not advice, just a chart
TradingView publications carry a standing disclaimer. Nothing here is financial, investment, or trading advice, and the platform does not endorse the call.
The essence
Losing the Wave 4 low flipped the read from bullish to bearish, and the next real support sits down at 66.9K to 70K.