From TradingView · · 50s
Check NASDAQ:NVDA Pullback Depth
Verify trend strength on NVDA with pullback depth analysis to avoid exact ratios.
In brief
Verify trend strength on NVDA with pullback depth analysis to avoid exact ratios. Traders should assess NASDAQ:NVDA pullback depth using 216.1-221.1 zone to avoid exact ratios and target 240.2 as first objective. Originally reported by TradingView.
Pullback Depth Definition
Pullback depth measures market conviction and trend strength through price retracement from recent highs.
NVDA Current Pullback Zone
Price retreated into 216.1-221.1 zone with 17% volume profile and historical chart extremes.
ATR Context for NVDA

14-period ATR is 4.1 to contextualize pullback depth against last impulse origin.
First Objective Target
First objective at 240.2 supported by 0.9% volume shelf and previous swing high.
Second Objective Target
Second objective at 257.2 aligned with 161.8% projection and 8.7 ATR move.
Structural Failure Point
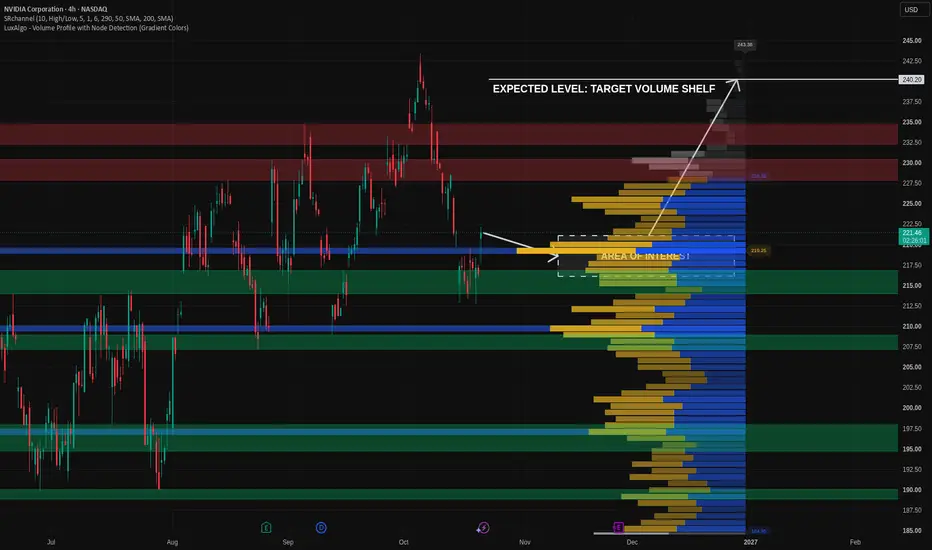
Pullback extends past 214.7 to break trend structure and invalidate scenario.
Here's the gist
Traders should assess NASDAQ:NVDA pullback depth using 216.1-221.1 zone to avoid exact ratios and target 240.2 as first objective.


