From TradingView · · 1m 30s
Dollar index structure will reveal the next major move
Elliott Wave analysis shows DXY at a critical juncture where price structure, not just direction, will determine the path ahead.
In brief
Elliott Wave analysis shows DXY at a critical juncture where price structure, not just direction, will determine the path ahead. Watch how the dollar breaks out of key levels and what structure forms afterward, not just whether it goes up or down. Originally reported by TradingView.
Structure matters more than direction
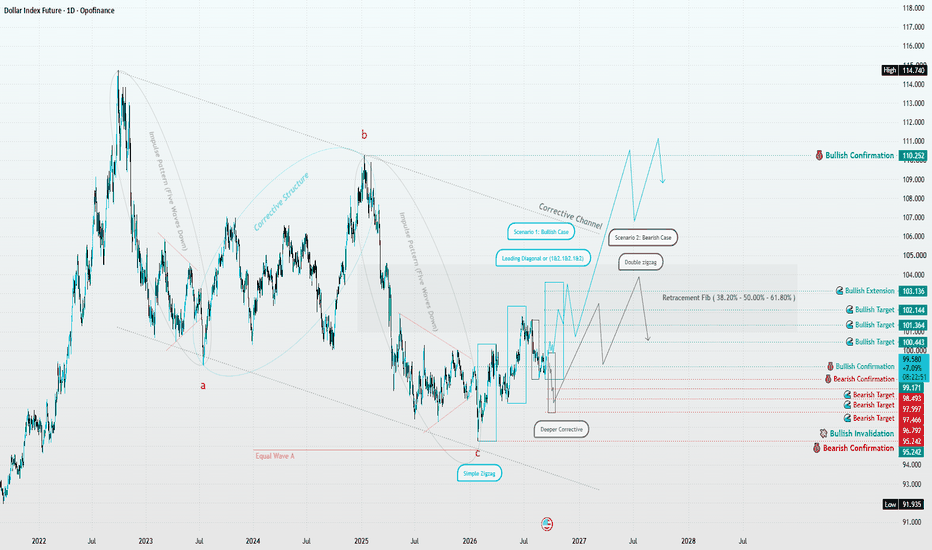
The dollar's next major path depends on what pattern forms, not just whether price moves up or down. The 2-hour chart will reveal which scenario is building.
“Structure First. Scenario Second.”
Bullish case needs valid breakout
If the recent correction is done, DXY should break decisively out of marked black boxes and form a proper Wave 1 motive structure to confirm bulls are in control.
Simple price rise isn't enough
Just seeing the dollar move higher doesn't confirm the bullish scenario. It must develop a valid motive structure after breaking out of key levels.
“simply seeing price move higher is not enough”
Bearish scenario still in play
If price moves past the previous peak but fails to form a strong bullish structure, the market could be building another corrective zigzag pattern instead.
Deeper correction remains possible
A failed breakout followed by a valid bearish structure would signal a deeper, more time-consuming correction is developing for the dollar index.
Let the market decide
The higher timeframe provides the map, but the 2-hour chart must show which path is actually forming. Quality of structure determines which scenario wins.
“The higher timeframe gives us the map; the 2-hour chart must show us which path the market is actually building.”
The main idea
Watch how the dollar breaks out of key levels and what structure forms afterward, not just whether it goes up or down.