From TradingView · · 1m 10s
DXY Stays Within Bullish Trend Structure
DXY index remains within broader bullish trend structure as price action shows bearish shift.
In brief
DXY index remains within broader bullish trend structure as price action shows bearish shift. DXY index shows bearish continuation with price below 102.200-102.400 resistance zone. Originally reported by TradingView.
DXY Bullish Trend Structure
DXY index previously showed strong bullish trend with higher highs and higher lows from mid-September to mid-October.
Price Action Change
DXY reached 102.950 resistance but failed to sustain upward momentum, signaling bearish change of character.
Liquidity Rejection

Price tested 102.950 but encountered significant selling pressure, breaking through minor swing lows.
Current Consolidation
DXY is hovering around 101.850 with temporary equilibrium between buyers and sellers.
Elliott Wave Analysis
Bullish movement since mid-September could form five-wave impulsive structure with wave 5 at 102.950.
ABC Correction Projection
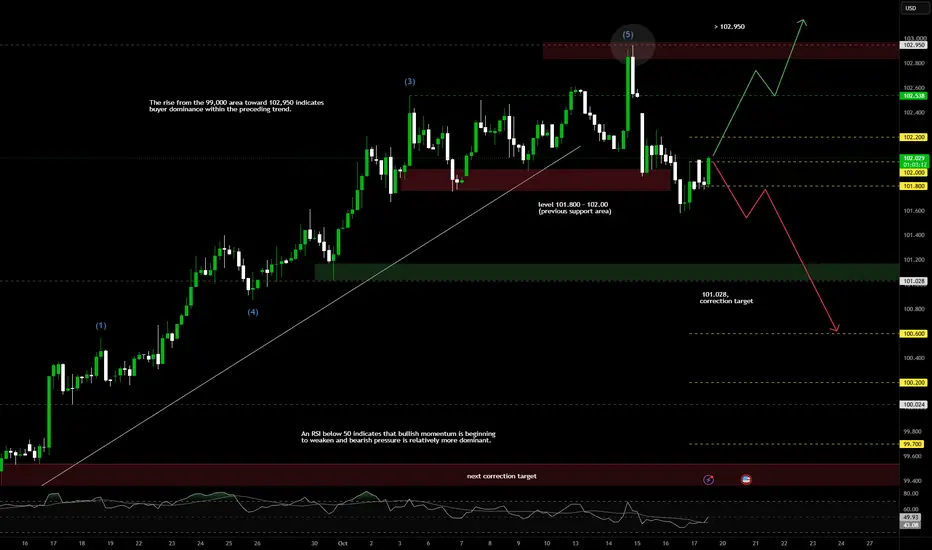
Price may decline to 101.600 before potentially falling to 101.028 if resistance holds.
RSI Momentum Analysis
RSI indicator shows reading of 43.98 with bullish momentum weakening and bearish pressure dominant.
Trading Bias Scenarios
DXY likely to see limited rebound toward 102.000-102.200 before resuming decline toward 101.600.
The takeaway
DXY index shows bearish continuation with price below 102.200-102.400 resistance zone.


