From TradingView · · 1m 10s
EML: Gap, Candle Body and Daily Return Use Different Bases
Eastern Company's daily candle shows how open-to-close and open-to-current prices differ.
In brief
Eastern Company's daily candle shows how open-to-close and open-to-current prices differ. Eastern Company's October 27 candle body and daily return use different starting points to avoid confusion. Originally reported by TradingView.
Eastern Company's October 27 candle
Eastern Company's October 27 daily candle opened at 24.5300 after closing at 24.1300 the previous day.
Price gap and daily return
The price gap is 1.6577% and the daily return is 8.58% using different starting points.
Technical calculation

Multiplying the return factors shows the gap and body return are separate intervals.
Candle body details
The candle body was 24.5300 to 26.8200 with a current price of 26.2000.
Market context
Eastern Company is an industrial manufacturer serving commercial transportation and logistics markets.
50% midpoint
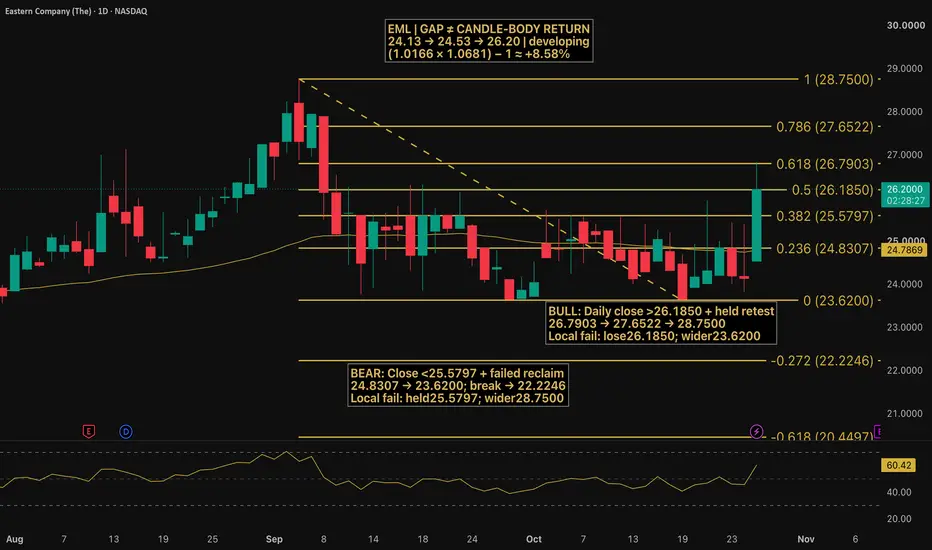
The 50% midpoint is 26.1850 with price currently 0.0150 above it.
Technical indicators
The 55 EMA was 24.7869 and RSI was 60.42, showing improved momentum.
Next steps
A bullish sequence requires a daily close above 26.1850 followed by a retest that holds.
The takeaway
Eastern Company's October 27 candle body and daily return use different starting points to avoid confusion.