From TradingView · · 30s
EURUSD Chart Analysis
TradingView chart shows EURUSD bouncing after sweeping liquidity pool.
In brief
TradingView chart shows EURUSD bouncing after sweeping liquidity pool. EURUSD price rebounded after capturing sell-side liquidity at 1.12000. Originally reported by TradingView.
Macro Structure
The EURUSD pair experienced a massive uptrend throughout 2025, peaking in early 2026.
Liquidity Sweep
Price dropped aggressively to sweep a major historical sell-side liquidity pool marked by pink line at 1.12000.
Bullish Reversal
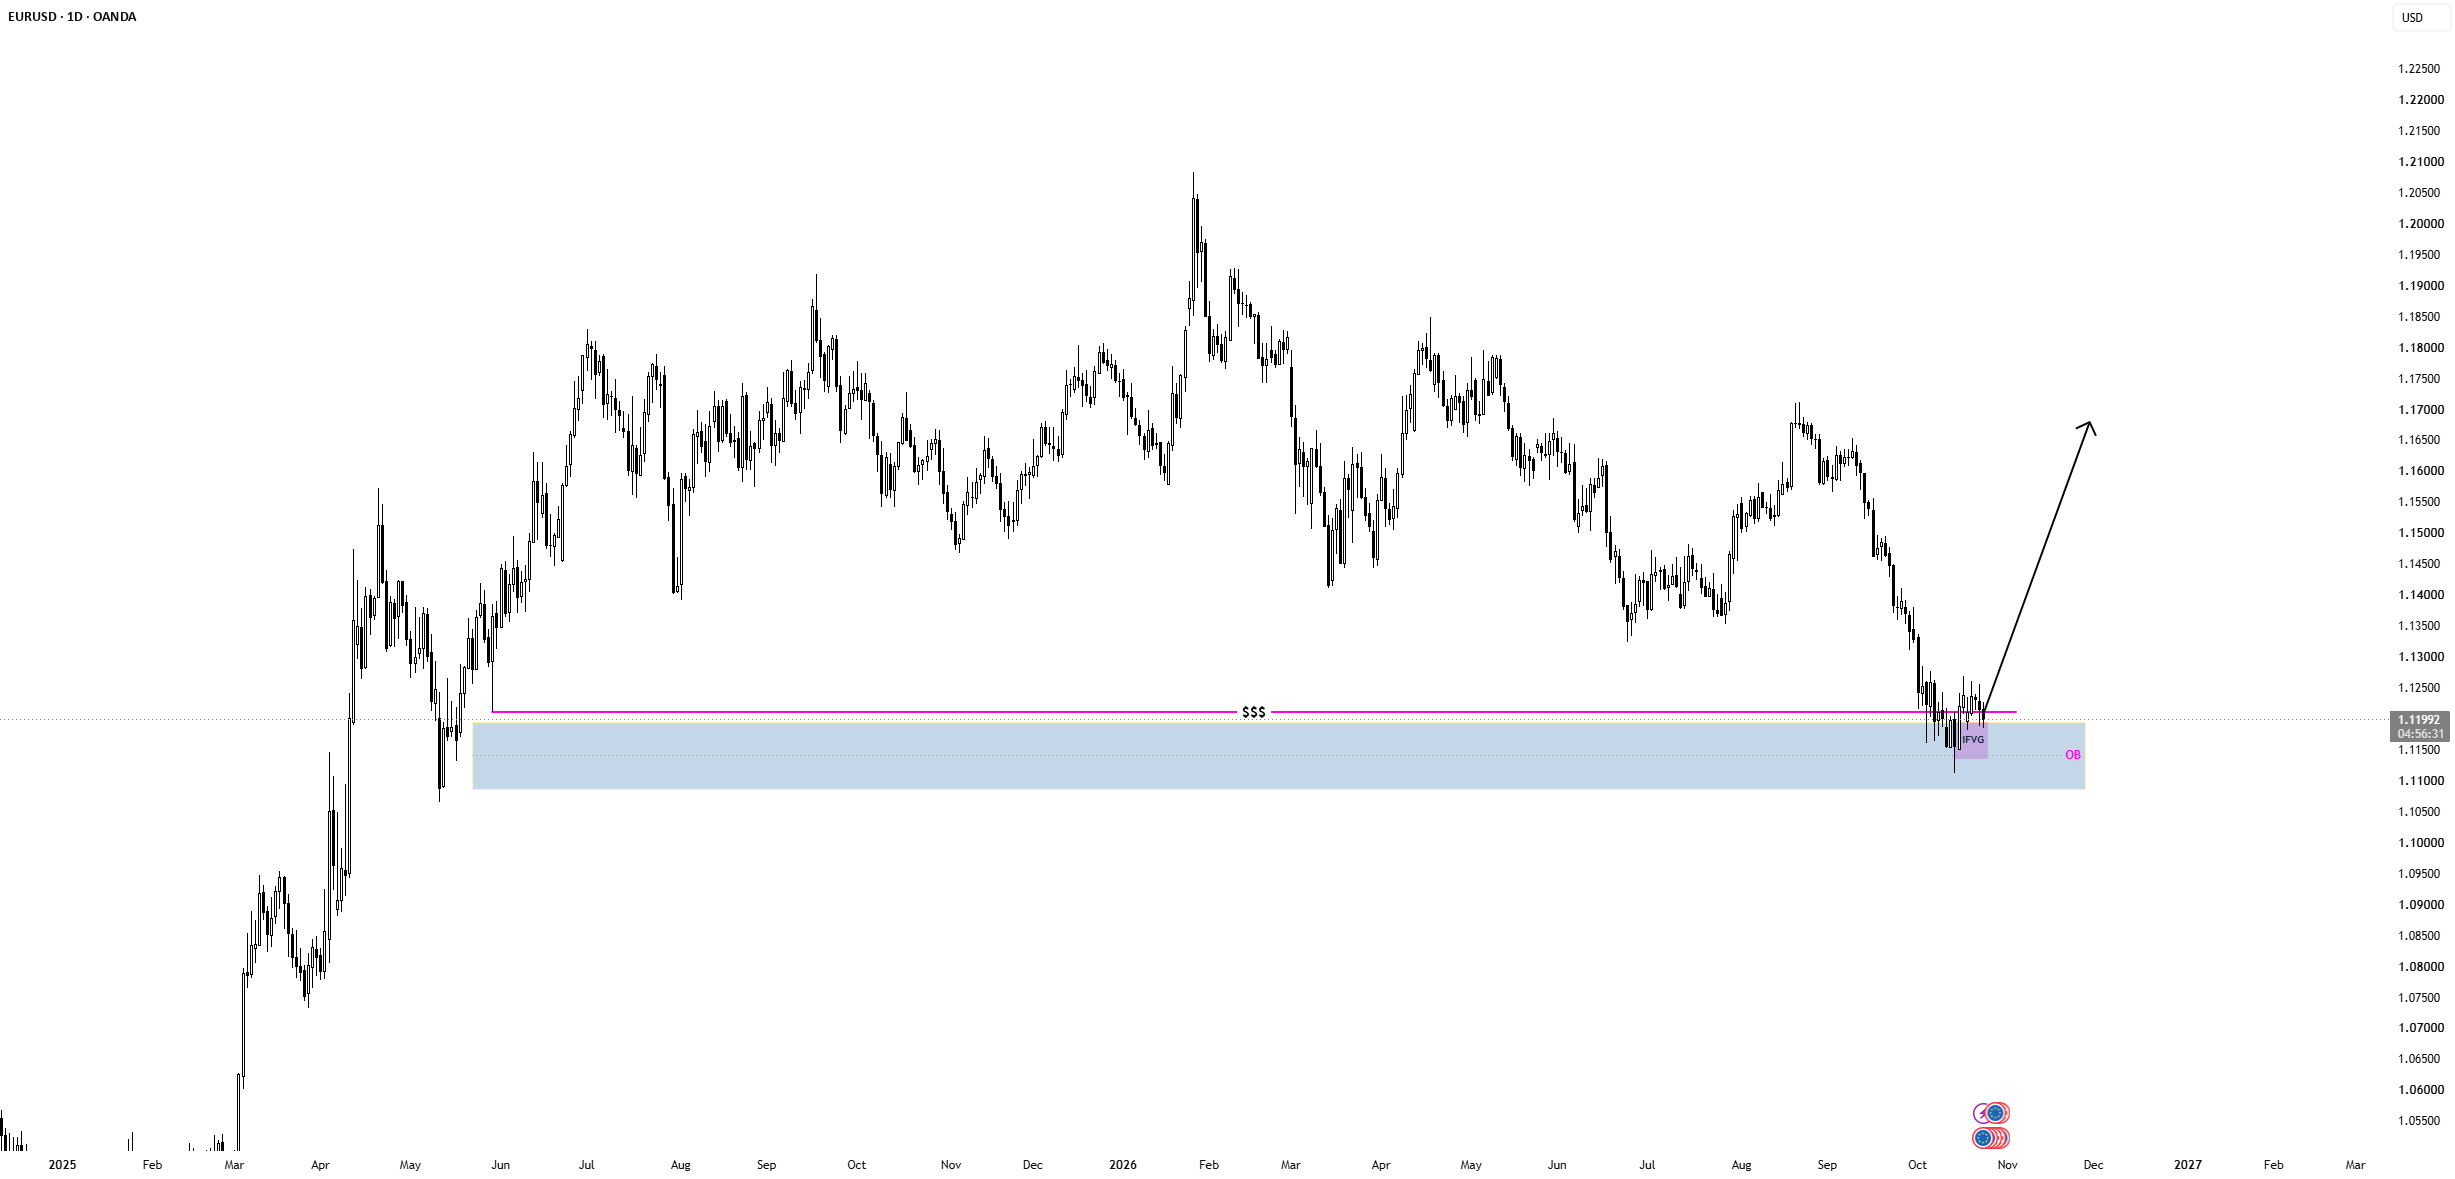
Price tapped massive order block after sweeping liquidity, indicating potential upward bounce.
At a glance
EURUSD price rebounded after capturing sell-side liquidity at 1.12000.