From TradingView · · 1m
First Solar Stock Chart Analysis
First Solar stock chart shows market pricing its solar tech sector as a mature cash generator with 7x EV/EBITDA multiple.
In brief
First Solar stock chart shows market pricing its solar tech sector as a mature cash generator with 7x EV/EBITDA multiple. First Solar's stock is valued at 7x EV/EBITDA, suggesting the market views its solar tech sector as a mature cash-generating utility. Originally reported by TradingView.
First Solar Overview
First Solar is a solar technology company that designs, manufactures, and sells cadmium telluride solar modules.
Financial Metrics
First Solar has a basic EPS of 16.27 USD, 27.89% FCF margin, and a price to earnings ratio of 10.75.
Valuation Metrics

First Solar's EV/EBITDA multiple is 7.03, suggesting the market views it as a mature cash-generating utility sector.
Multiple Time-Frame Analysis
The chart shows strength favoring higher timeframes with color-coded candle patterns for different time intervals.
Support and Resistance
Support and resistance levels are defined by 2+ consecutive colored candles in the chart analysis.
Trading Strategy
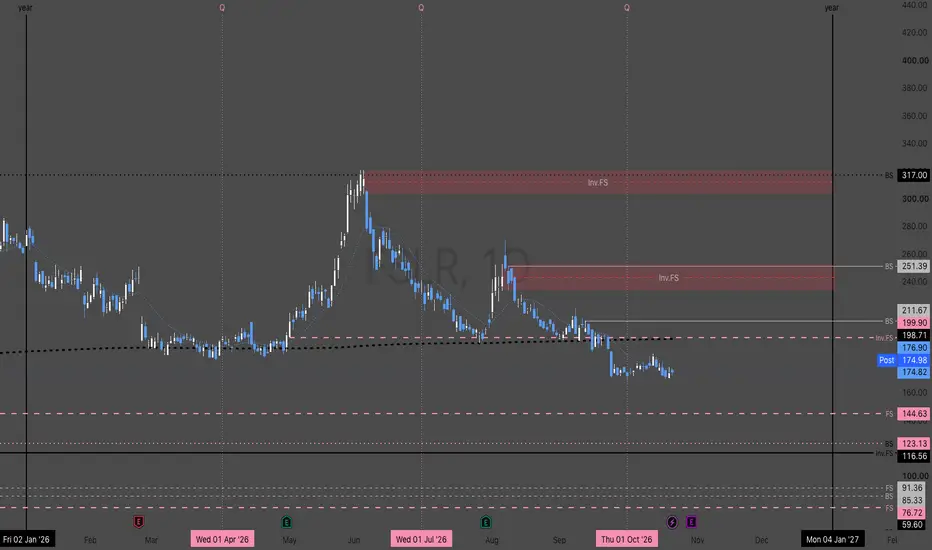
Accumulation ranges close higher than they open, while distribution ranges close lower than they open.
At a glance
First Solar's stock is valued at 7x EV/EBITDA, suggesting the market views its solar tech sector as a mature cash-generating utility.


