From TradingView · · 30s
GBPCAD Chart Analysis
TradingView chart shows GBP/USD liquidity grab signals potential seller entry.
In brief
TradingView chart shows GBP/USD liquidity grab signals potential seller entry. GBP/USD liquidity grab in premium zone indicates large seller entry. Originally reported by TradingView.
Chart Analysis
The equal highs at the top of the range were inducement for breakout buyers' orders and sellers' stop losses stacked above them.
Liquidity Grab
The long wick on October 17, 18 reversed as a textbook liquidity grab because price never closed above those highs.
Seller Entry
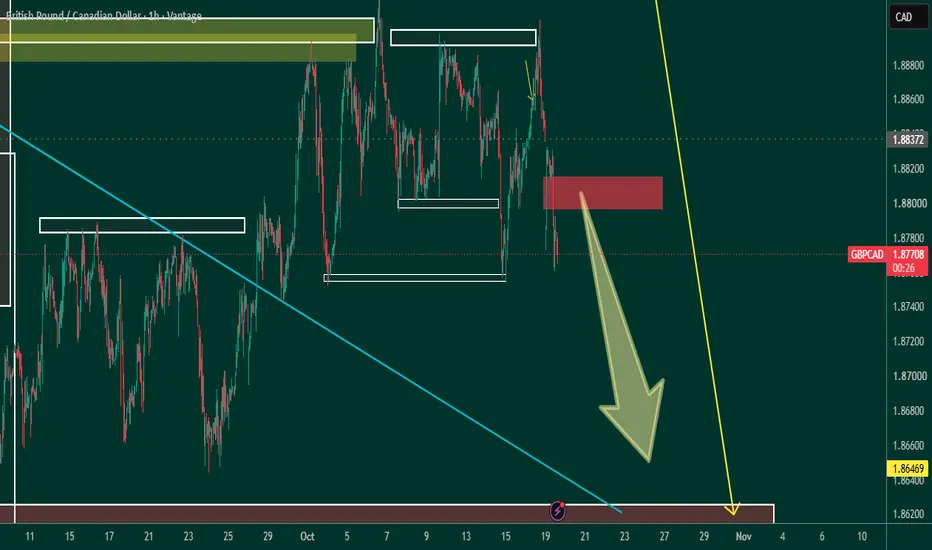
The liquidity grab in the premium zone indicates a large seller entered there.
The key point
GBP/USD liquidity grab in premium zone indicates large seller entry.