From TradingView · · 1m 30s
GBP/USD coils into a triangle
A four-hour triangle on cable is closing in on its final wave, and the thrust out of it could be big.
In brief
A four-hour triangle on cable is closing in on its final wave, and the thrust out of it could be big. If Wave E stalls near 1.3345, the triangle's measured thrust points at 1.4200; a break the other way puts 1.2485 on the table. Originally reported by TradingView.
Cable is squeezing tighter
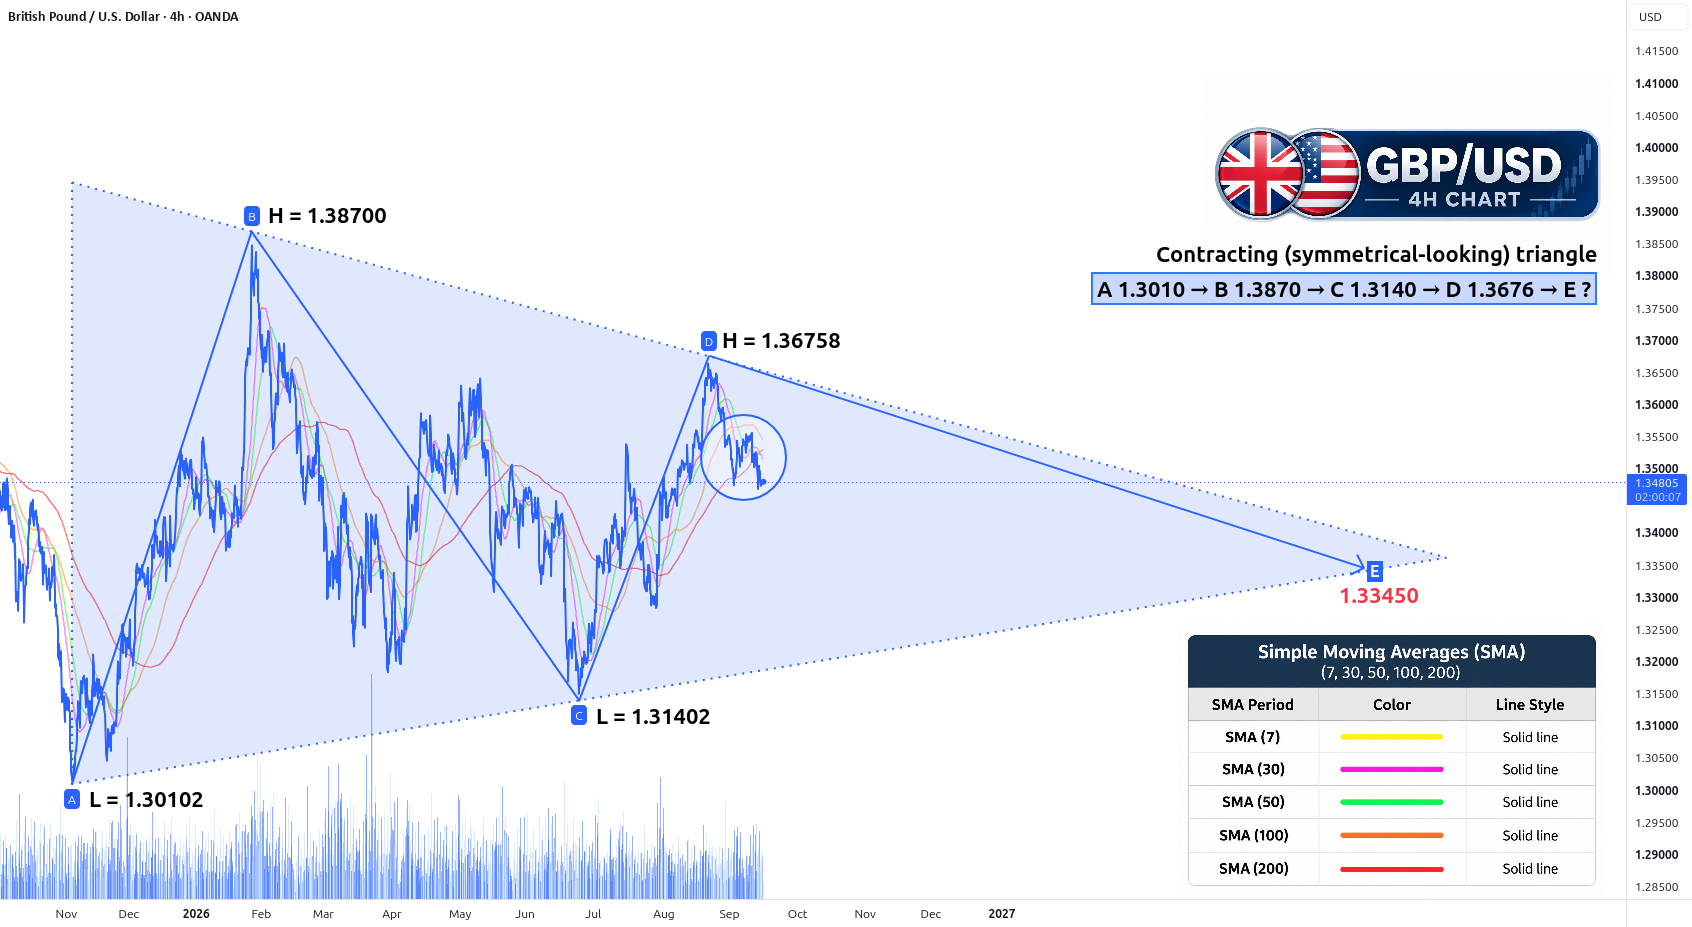
GBP/USD is tracing a contracting, symmetrical-looking triangle on the 4-hour chart. Price keeps making lower highs and higher lows inside converging lines.
“GBPUSD appears to be forming a contracting, symmetrical-looking triangle on the 4-hour chart.”
Four waves down, one to go
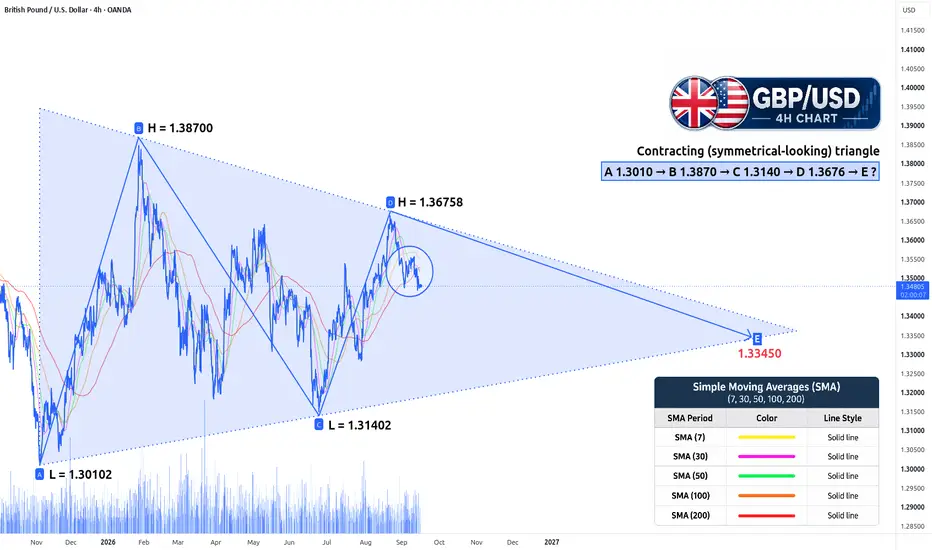
The count reads A at 1.3010, B at 1.3870, C at 1.3140, D at 1.3676, with Wave E still unfolding. Four legs are set, the fifth is live.
“The pattern currently shows a possible A-B-C-D-E structure, with Wave E still developing.”
The trendlines confirm it

A-C and B-D both converge, which is what makes this a contracting triangle rather than a random range. The lines are the pattern, not the labels.
“The converging A-C and B-D trendlines support the contracting-triangle view.”
Wave E has a hard limit
Under the rules, Wave E cannot push past where Wave C ended at 1.3140. It can also stop short of the A-C line, so an early turn is fair game.
“Wave E cannot move beyond the end of Wave C, although it can finish before reaching the A-C trendline.”
1.3345 is the level to watch
The 0.618 retracement puts the Wave E target at 1.3345. That is where the setup either completes or starts falling apart.
“Wave E target: 1.3345 [0.618]”
The thrust cuts both ways
Triangle height is 0.0860, from 1.3870 down to 1.3010. Added to 1.3345 that projects 1.4205 on the upside; subtracted, it points to 1.2485.
“1.3345 + 0.0860 = 1.4205”
What to remember
If Wave E stalls near 1.3345, the triangle's measured thrust points at 1.4200; a break the other way puts 1.2485 on the table.