From TradingView · · 1m
Gold bounces from support on hourly chart
Gold recovers from a key support level and eyes resistance on the one-hour timeframe.
In brief
Gold recovers from a key support level and eyes resistance on the one-hour timeframe. Gold is trading near 4,327 after bouncing from support at 4,261.360, with resistance overhead at 4,403.030. Originally reported by TradingView.
Gold bounces from key support
Gold is trading around 4,327 on the one-hour chart after recovering from the lower price area near support at 4,261.360.
Two critical price levels marked
Support sits at 4,261.360 while resistance is positioned at 4,403.030, defining the trading range on this timeframe.
Short-term recovery underway
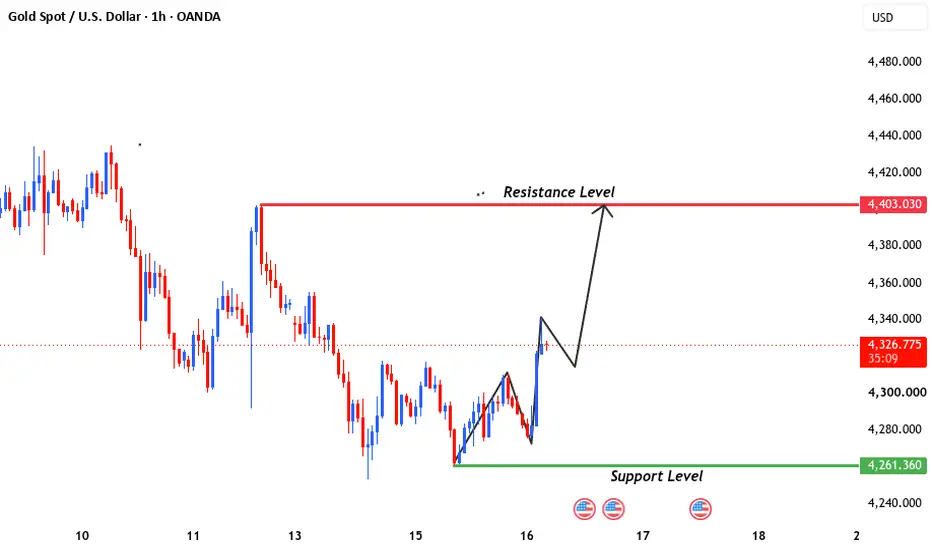
Price has moved upward from support, creating a short-term recovery, though the broader market remains trapped between support and resistance.
Resistance test could confirm move
If buying interest continues, gold may retest the resistance area at 4,403.030. A sustained move above this level would require confirmation from subsequent price action.
“A sustained move above resistance would require confirmation from subsequent price action.”
Rejection could trigger pullback
If price encounters selling pressure at resistance, a rejection could lead to another pullback toward the support level.
What matters most
Gold is trading near 4,327 after bouncing from support at 4,261.360, with resistance overhead at 4,403.030.