From TradingView · · 1m 10s
Gold Chart Shows Supply Zone Rejection
Gold price rejected key supply zone near $4,343 on 15-min chart.
In brief
Gold price rejected key supply zone near $4,343 on 15-min chart. Gold price rejected a $4,343, $4,358 supply zone on 15-minute chart, signaling potential bearish correction toward $4,244.63. Originally reported by TradingView.
Gold Chart Update
On the 15-minute timeframe, Gold (XAUUSD) has rallied into a key overhead supply block/resistance zone near the $4,343, $4,358 region.
Technical Reference Levels
Overhead Supply / Entry Zone: ~$4,343.85, $4,349.09 (Supply Block / Channel Resistance) Invalidation / Structural Level: ~$4,358.66 (Above the supply zone high) Downside Target Level: ~$4,244.63 (Major lower demand / support liquidity zone).
Technical Setup Logic
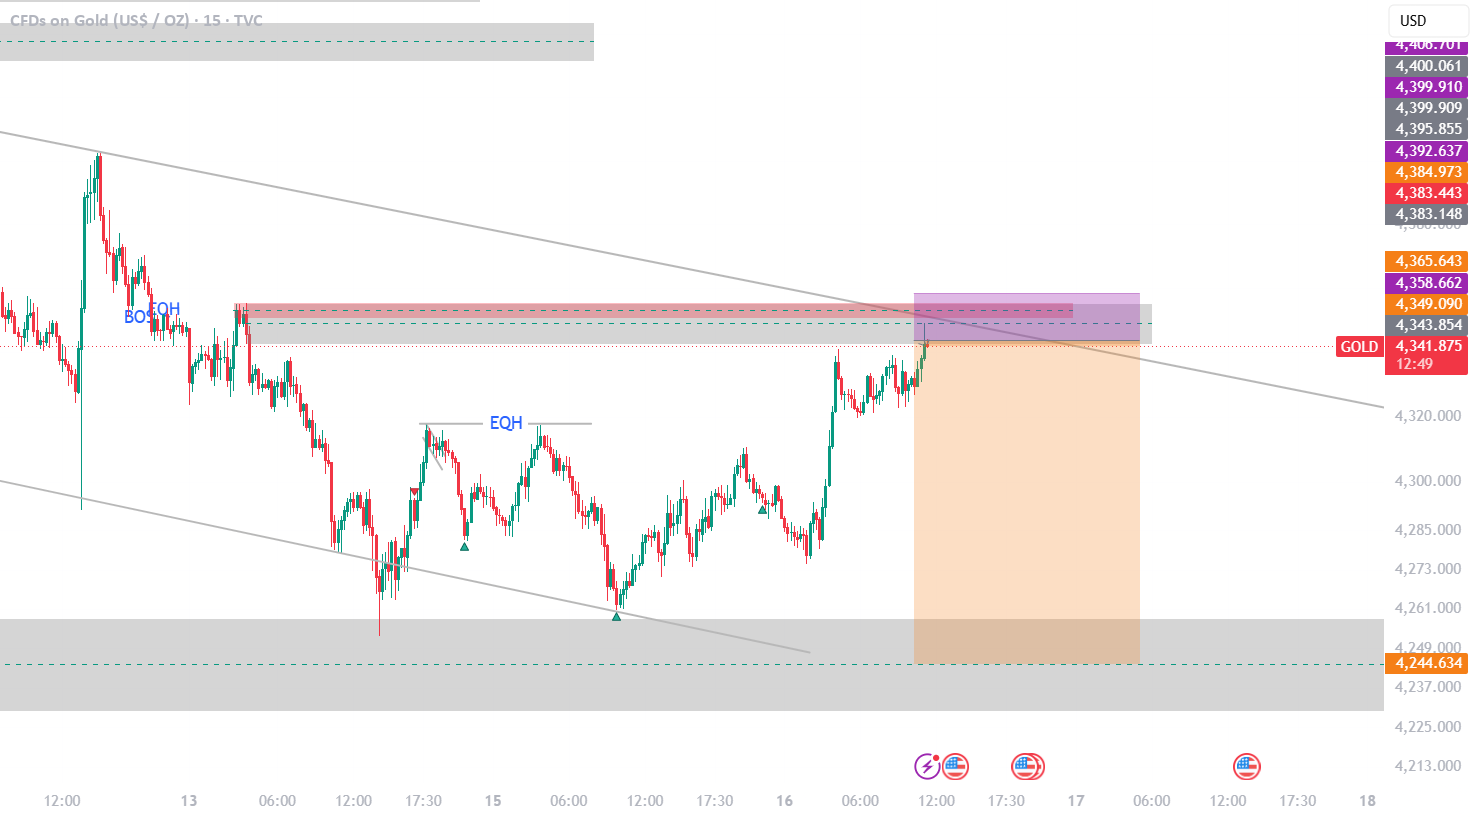
Price expanded into the upper supply zone and descending trendline resistance around $4,343.85. The technical mapping outlines a potential rejection from this premium supply area to continue the broader corrective trend toward the lower support target at $4,244.63.
Structural Invalidation
Structural invalidation strictly placed above $4,358.66.
Disclaimer
This post is strictly for educational, analytical, and charting practice purposes only. It is not a financial idea, trading signal, or investment advice. Always manage your own risk and perform independent research.
The headline
Gold price rejected a $4,343, $4,358 supply zone on 15-minute chart, signaling potential bearish correction toward $4,244.63.