From TradingView · · 1m
Gold consolidates below key Fibonacci level
Technical analysis shows gold price action at critical support zones with two potential scenarios ahead.
In brief
Technical analysis shows gold price action at critical support zones with two potential scenarios ahead. Gold is consolidating below the 0.5 Fibonacci level, with price action at this zone determining whether downside continues or reversal occurs. Originally reported by TradingView.
Gold consolidating below key level
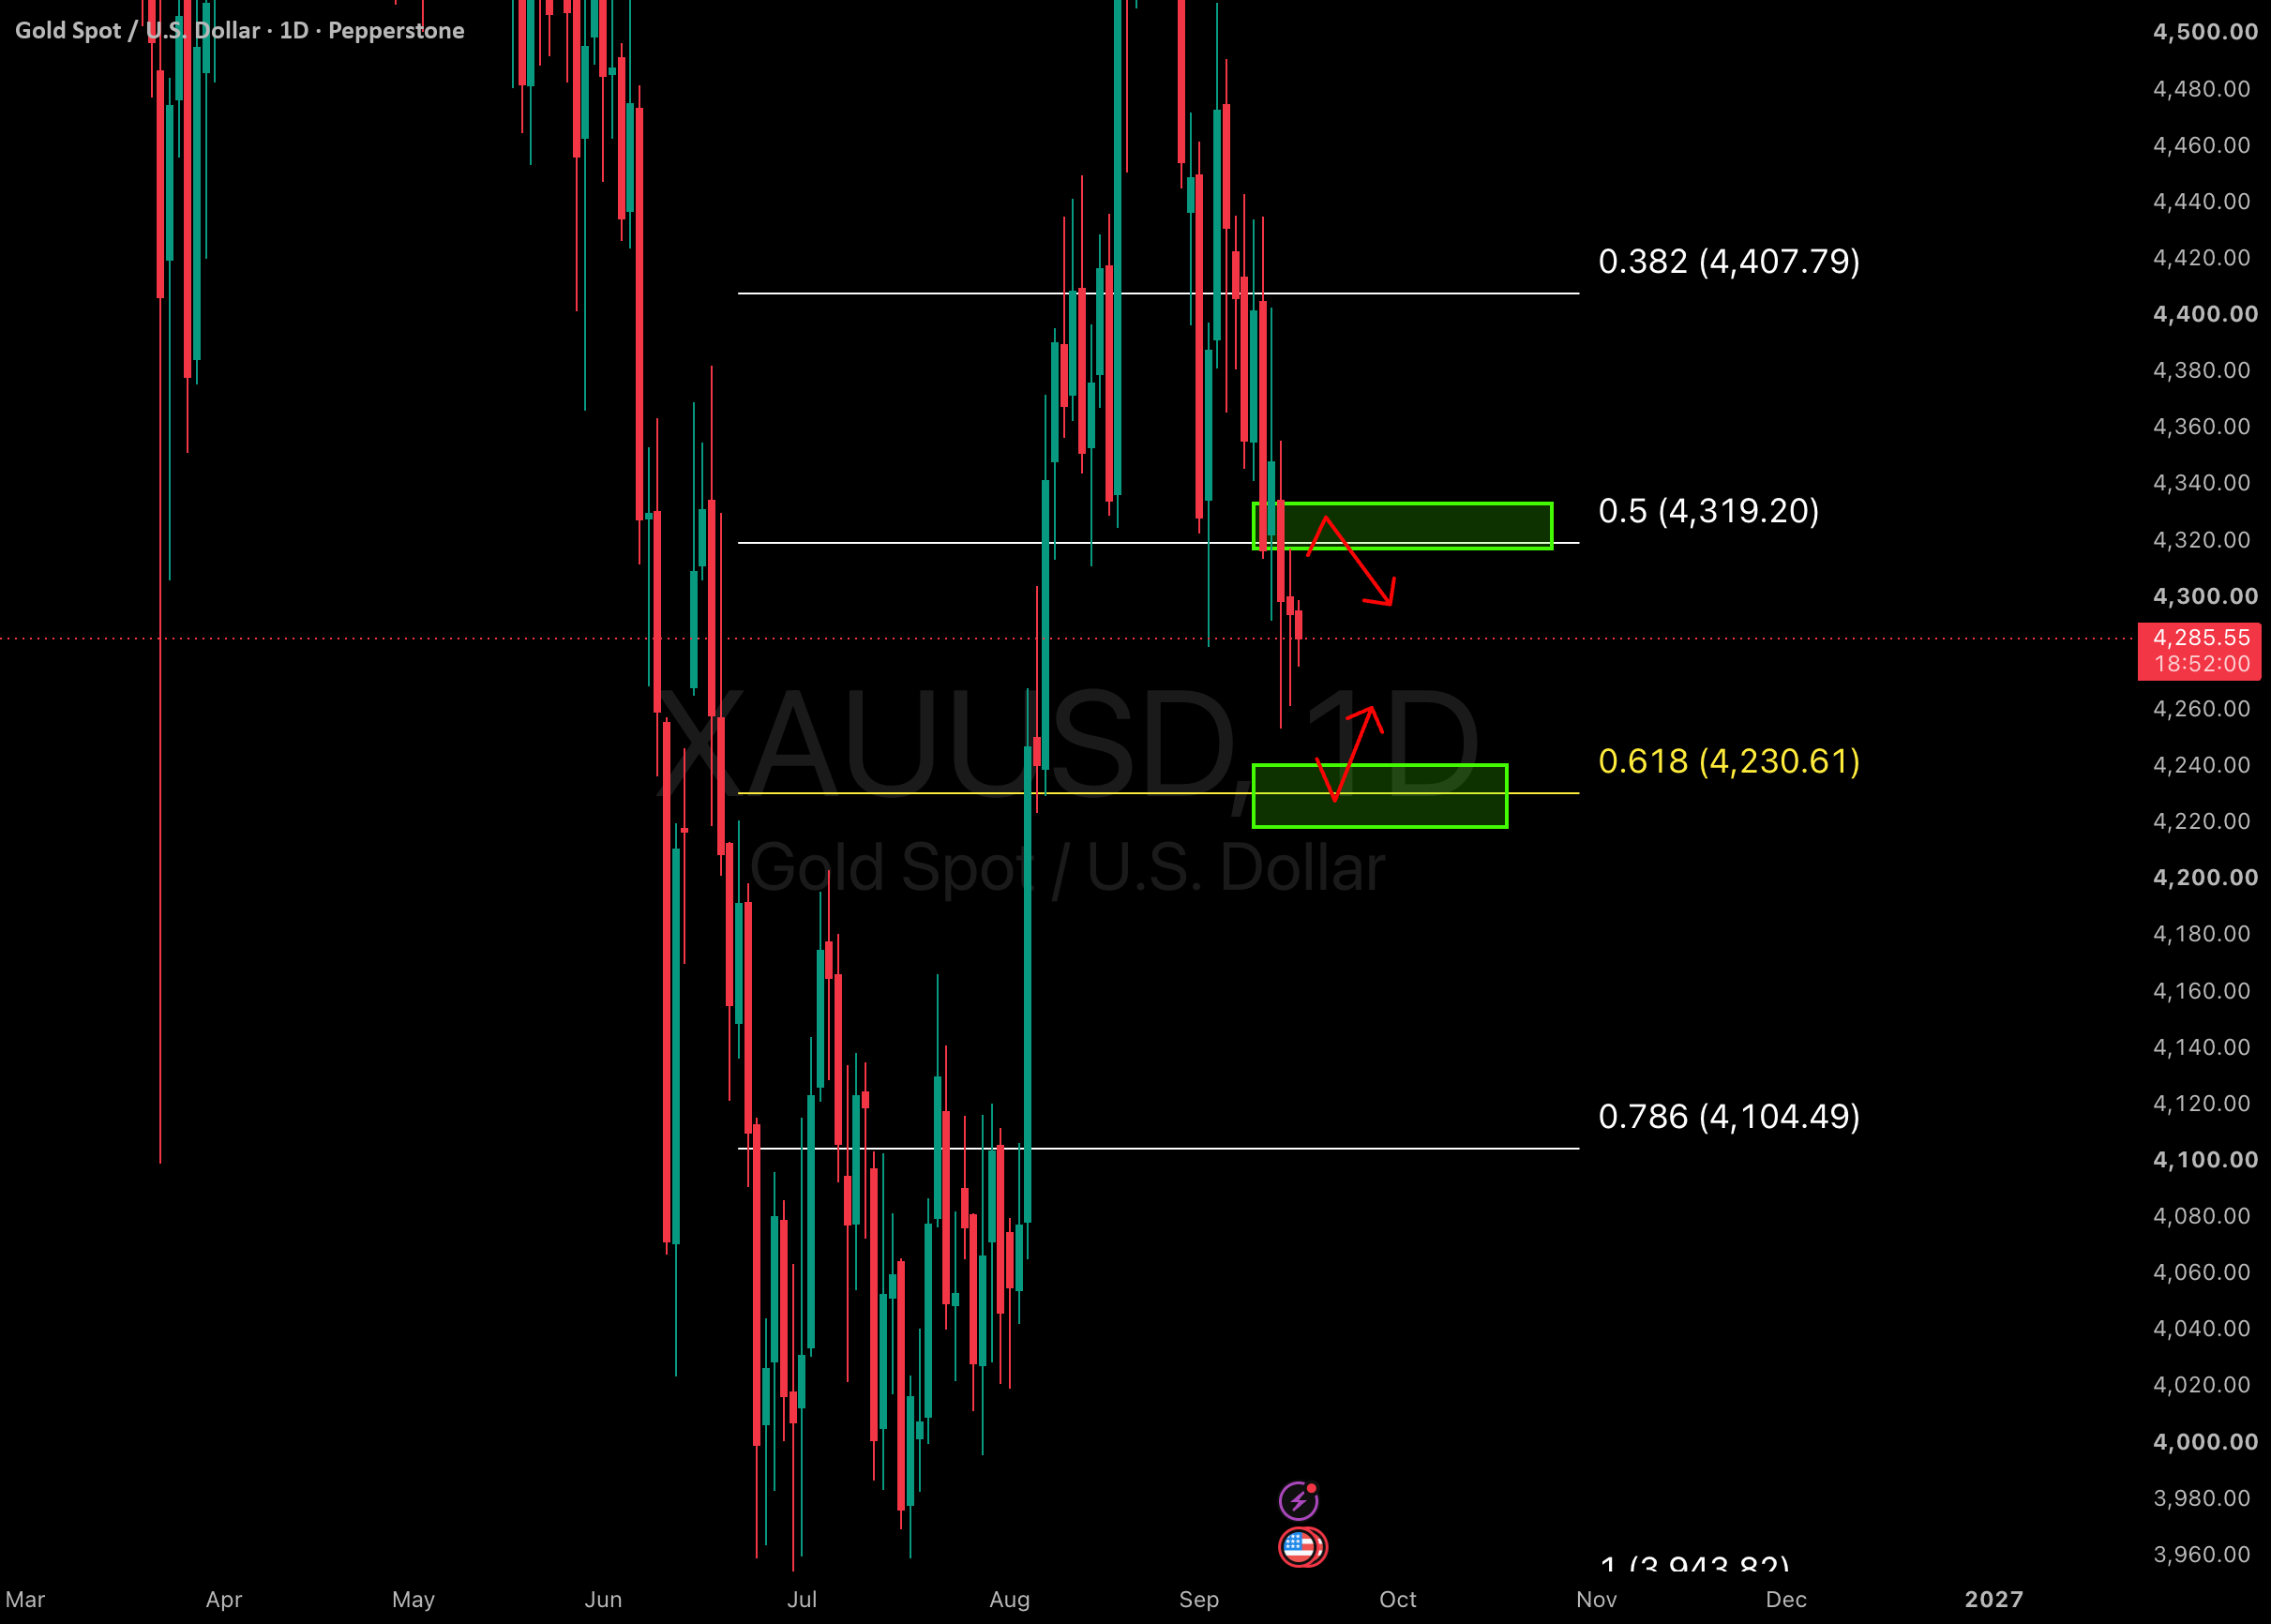
The gold price is consolidating below the 0.5 Fibonacci level, a critical technical support zone.
Retest signals downside continuation
If price retests the 0.5 Fib level, traders should look for downside continuation in the gold market.
“If price retests the 0.5 Fib level, look for downside continuation.”
Deeper retracement offers reversal setup
A retracement to the 0.618 Fibonacci level could signal a potential reversal to the upside for gold.
“If price retraces to the 0.618 Fib level, look for a potential reversal to the upside.”
Two scenarios to watch
Traders face two distinct paths: downside continuation at 0.5 or upside reversal at 0.618 Fibonacci levels.
Key Fibonacci zones define action
The 0.5 and 0.618 Fibonacci retracement levels are the critical zones determining gold's next major move.
At a glance
Gold is consolidating below the 0.5 Fibonacci level, with price action at this zone determining whether downside continues or reversal occurs.