From TradingView · · 1m 20s
Gold Price Action Analysis
Gold's 4H chart shows key resistance zones and potential trade setups.
In brief
Gold's 4H chart shows key resistance zones and potential trade setups. Gold faces resistance at $4,200 with potential targets at $4,274 and $4,348 if it breaks above resistance. Originally reported by TradingView.
Key Market Levels
Major resistance at 4,435, resistance 2 at 4,348, resistance 1 at 4,274, key resistance at 4,200, supply zone 4,165, 4,200, support 1 at 4,097, support 2 at 4,066.
Price Action Explanation
Initial bullish candles show buying pressure; rejection at upper resistance may indicate profit-taking; bearish continuation candles support downward trend.
Bullish Scenario

Strong close above 4,200 followed by retests of 4,274 and 4,348 may target 4,435 resistance.
Bearish Scenario
Rejection below 4,165, 4,200 and close below 4,097 may target 4,066 support zone for further downside.
Risk Management
Use confirmation, predefined stop-loss, and position sizing before entering trades; avoid levels alone.
Educational Points
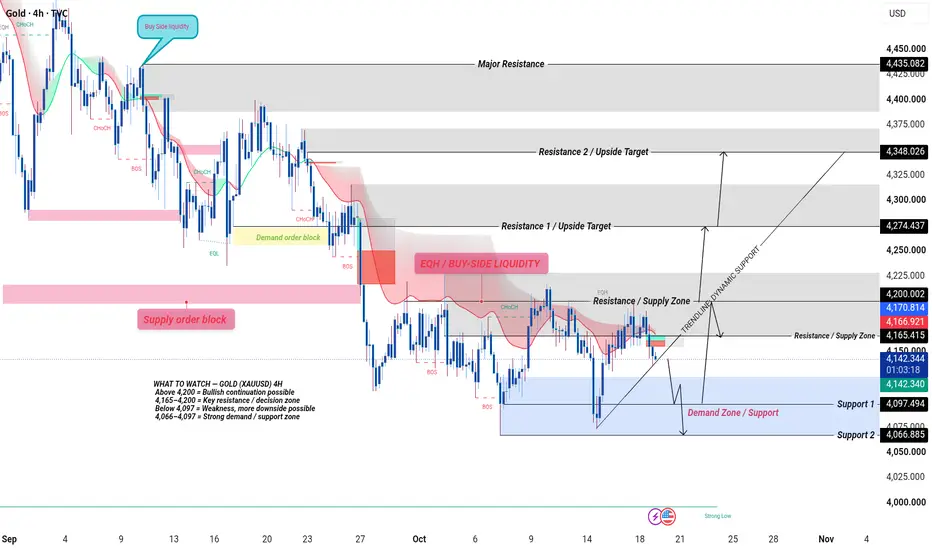
Watch for BOS, CHoCH, EQH, liquidity sweeps, supply and demand reactions, trendline breakouts.
Current Market Conditions
Gold shows short-term selling pressure around $4,130, $4,145 due to stronger US dollar, elevated Treasury yields, and Fed policy uncertainty.
Key Levels for Trade
4,200: major decision level; 4,165, 4,200: resistance/supply zone; 4,097: first support; 4,066: second support/demand zone.
What Happens Next
Price may break above 4,200 to target 4,274 and 4,348 or fall below 4,097 to test 4,066 support.
The short version
Gold faces resistance at $4,200 with potential targets at $4,274 and $4,348 if it breaks above resistance.