From TradingView · · 1m 10s
Gold Price Analysis: Bearish Structure and Breakout Confirmation
Gold faces key resistance at 4,330 as bearish structure signals potential breakdown.
In brief
Gold faces key resistance at 4,330 as bearish structure signals potential breakdown. Gold's 4H chart shows bearish structure with resistance at 4,330; breakout above 4,250 may confirm bullish shift. Originally reported by TradingView.
Market Overview
Gold trades near 4,176 on 4H chart with lower highs beneath descending resistance trendline.
Dynamic Bearish Resistance
Descending resistance trendline acts as key reference for potential seller control if price recovers.
Key Structure Resistance

Resistance zone around 4,320, 4,340 where horizontal resistance and fair value gaps converge.
Breakout Confirmation Level
Breakout confirmation level at 4,250 requires sustained move above for bullish momentum.
Current Consolidation
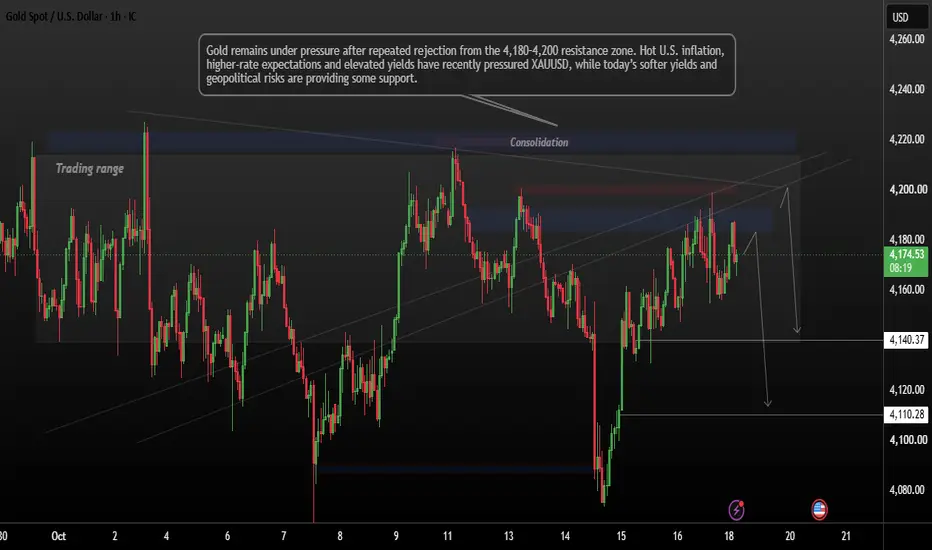
Gold consolidates around 4,130, 4,200 with fair value gaps and short-term reaction levels.
Sell-Side Liquidity
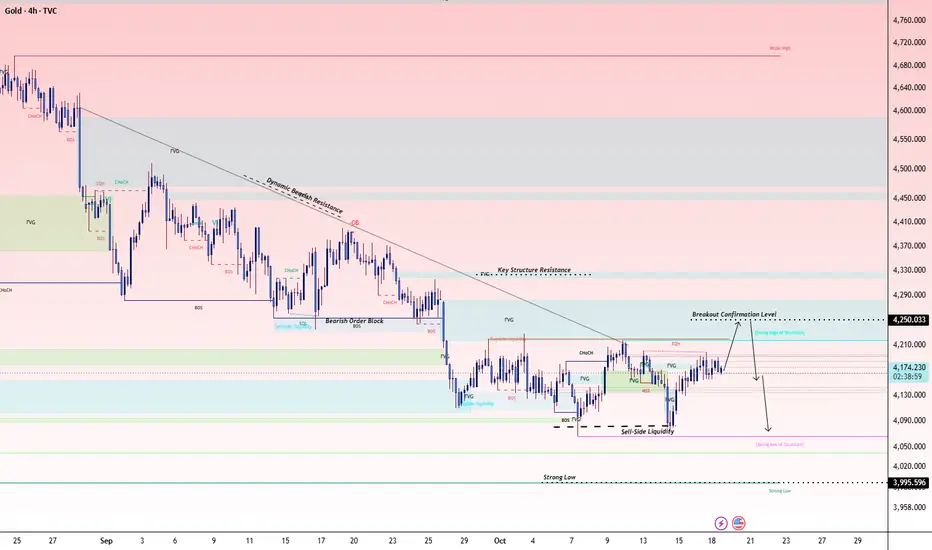
Sell-side liquidity beneath recent lows around 4,080, 4,090 may trigger further volatility.
Strong Low Region
Strong-low area near 3,995 could become relevant in deeper bearish scenario.
Bullish Scenario
Gold holds consolidation, forms higher low, reclaims resistance to target 4,250 breakout level.
Bearish Scenario
Price fails recovery, rejects resistance, breaks below 4,080, 4,090 liquidity region.
The takeaway
Gold's 4H chart shows bearish structure with resistance at 4,330; breakout above 4,250 may confirm bullish shift.