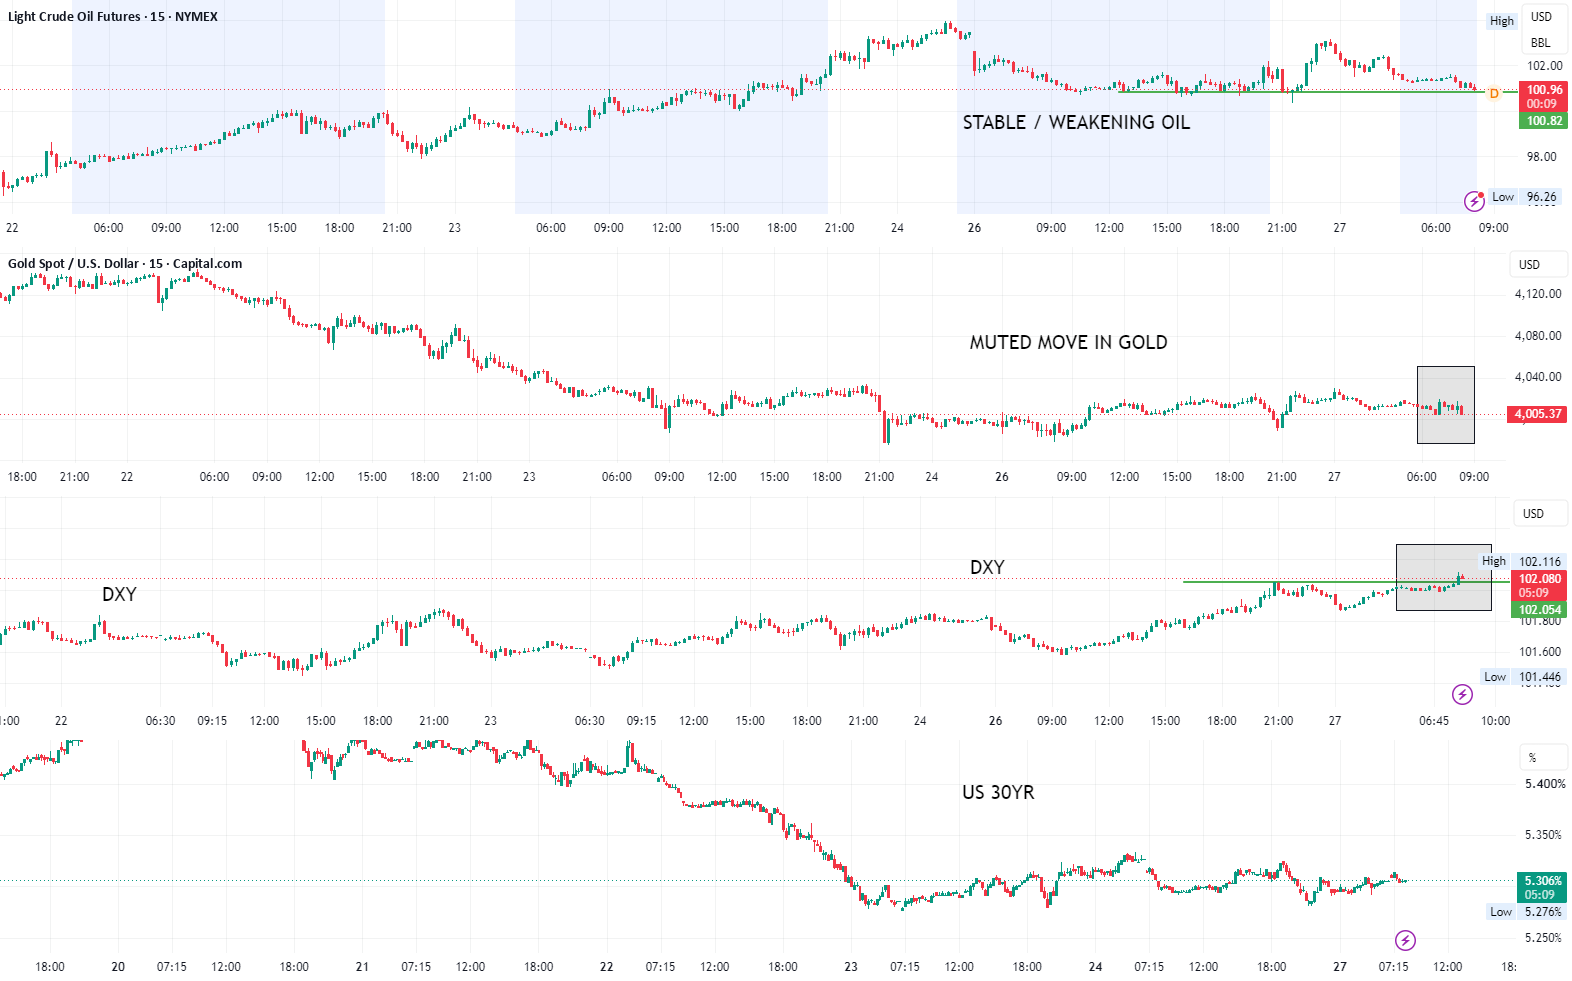
From TradingView · · 50s
Gold Price Analysis for October 27
Gold price analysis shows short-term bearish trends with key sell zones near $4,043, 4,050.
In brief
Gold price analysis shows short-term bearish trends with key sell zones near $4,043, 4,050. Gold price is consolidating around $4,000, $4,020 with sell zones at $4,043, 4,050 and $4,106, 4,113. Originally reported by TradingView.
Current Gold Price
Gold is trading around $4,012/oz after a sharp drop from $4,110, $4,120 to near $3,980, $3,990.
Market Focus
The market will focus on the Fed meeting on October 27, 28 with interest rates and US dollar key factors.
Technical Analysis
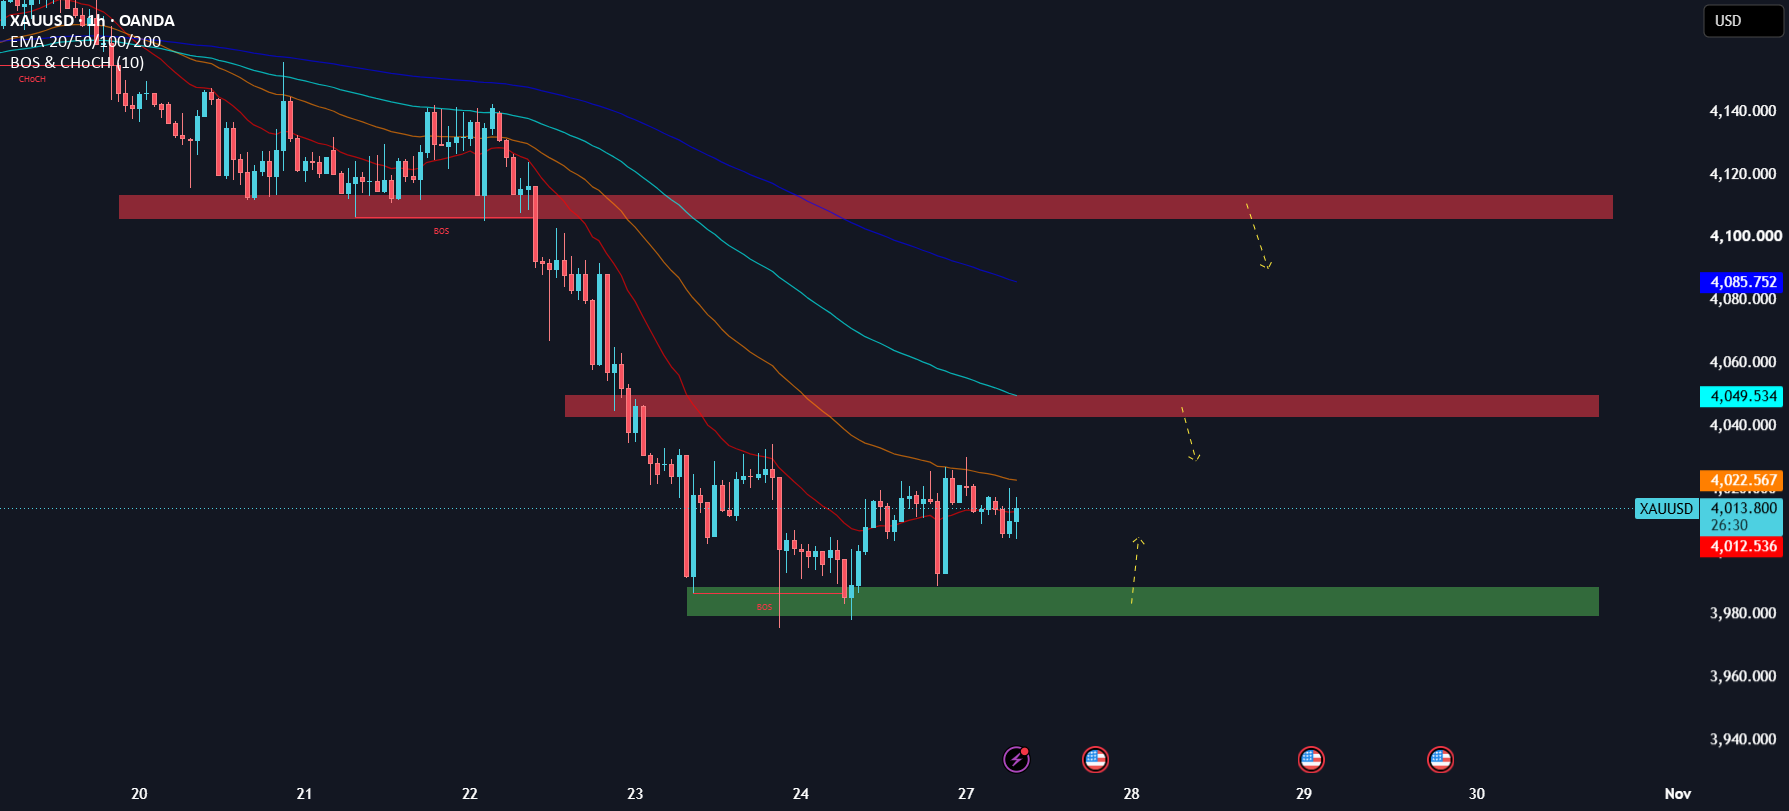
The H1 chart shows a bearish structure with price below EMA20, EMA50, EMA100, and EMA200 indicators.
Sell Zones
Sell zones at $4,043, 4,050 and $4,106, 4,113 where price may reverse to support.
Buy Zone
Buy zone at $3,980, 3,989 where demand triggered recent rebound.
The one thing
Gold price is consolidating around $4,000, $4,020 with sell zones at $4,043, 4,050 and $4,106, 4,113.