From TradingView · · 50s
Gold Spot Chart Shows Bearish Trend
Gold price drops below 4,280 as chart signals short-term bearish move.
In brief
Gold price drops below 4,280 as chart signals short-term bearish move. Gold is trending bearish after failing to break above 4,350-4,375 resistance, with potential support at 4,275-4,280. Originally reported by TradingView.
Market Structure Shift
Gold price repeatedly failed to break above 4,350-4,375 supply zone.
Key Resistance Area
4,350-4,375 remains dominant resistance where price tested multiple times but failed to sustain breakout.
Current Bearish Sequence
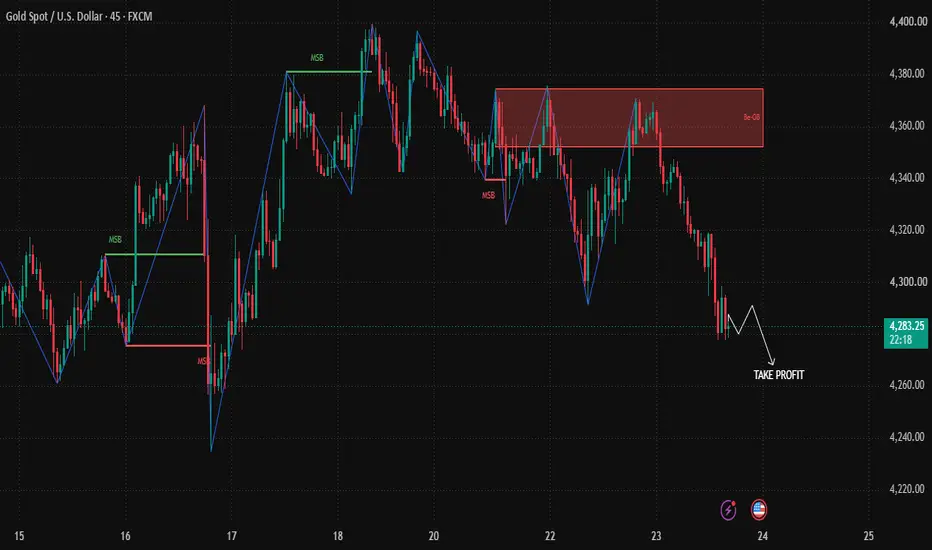
Price declined toward 4,280 after rejecting upper resistance, breaking below 4,320-4,340 swing levels.
Potential Support Levels
Immediate support at 4,275-4,280, next support at 4,260-4,265, with potential target at 4,245-4,255.
Short-Term Scenario
Possible bounce toward 4,290-4,300 before bearish continuation toward 4,260 and 4,245-4,255.
Invalidation Conditions
Bullish scenario requires price to reclaim 4,320-4,340 with strong momentum or break above 4,350-4,375 supply zone.
The big picture
Gold is trending bearish after failing to break above 4,350-4,375 resistance, with potential support at 4,275-4,280.