From TradingView · · 50s
MU Uptrend Breaks?
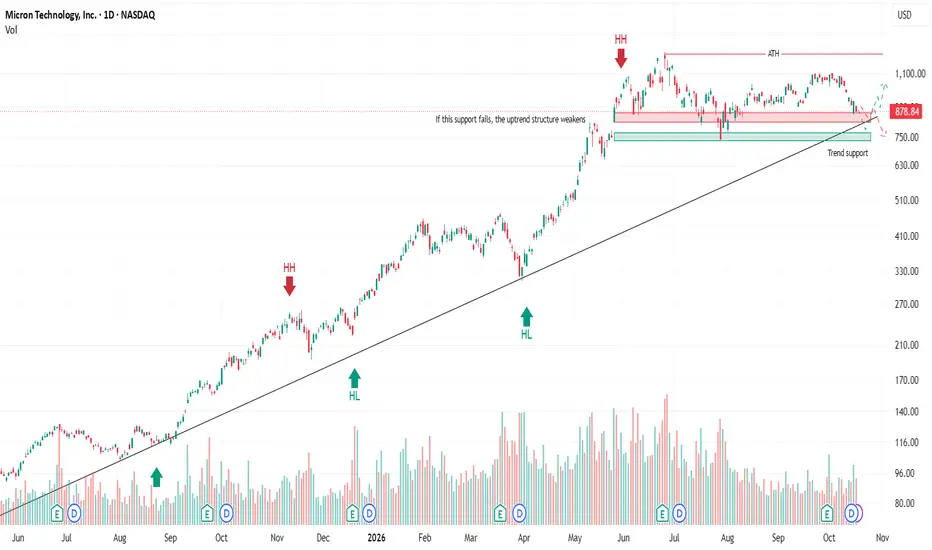
Micron's chart tests if the uptrend holds after 30% drop.
In brief
Micron's chart tests if the uptrend holds after 30% drop. Micron's stock may break its uptrend if it fails to form a higher low after a 30% correction. Originally reported by TradingView.
Current Trend Test
Micron's stock tests ascending support after 30% correction from $1,250 peak.
Trendline History
Micron has followed ascending trendline since early 2025 with higher highs and higher lows.
Current Support Zone

Price testing $870-$900 support with potential rebound to $1,000-$1,030.
Failure Scenario
Breaking $870-$900 support could trigger $770-$800 zone for next reaction.
Historical High
Previous high at $1,250 remains critical for confirming trend continuation.
Business Context
Micron benefits from AI infrastructure but faces cyclical memory market challenges.
Key Question
Will Micron form a higher low to confirm uptrend or break trendline?
The takeaway
Micron's stock may break its uptrend if it fails to form a higher low after a 30% correction.