From TradingView · · 50s
NBIS Reclaims $180 Technical Levels
NBIS price breaks above YTD Anchored VWAP and 200-day SMA, signaling potential bullish reversal.
In brief
NBIS price breaks above YTD Anchored VWAP and 200-day SMA, signaling potential bullish reversal. NBIS price reclaims $180 and technical indicators, suggesting a potential bullish trend reversal. Originally reported by TradingView.
Technical Setup
NBIS price attempts to recover from recent selloff and reclaim two significant technical indicators.
Key Levels
YTD Anchored VWAP and 200-day Simple Moving Average (SMA) form critical support zones for price recovery.
Reclaim Target

Price must reclaim $180 and both technical indicators for confirmed bullish reversal.
Bullish Confirmation
Daily candle close above both indicators with price holding higher lows and rising 9 EMA.
Entry Strategy
Long position only after confirmed breakout and retest above $180 with indicators.
Risk Management
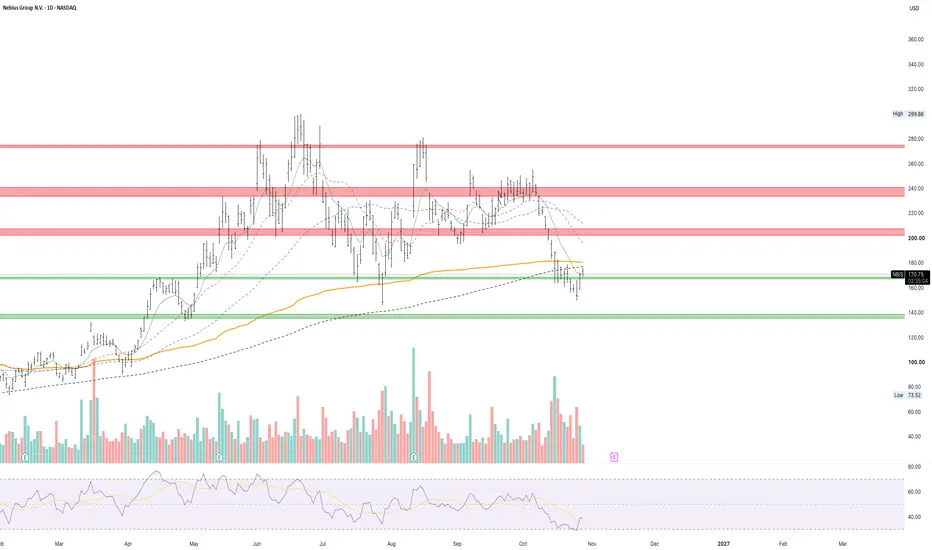
Stop loss below YTD Anchored VWAP or 200-day SMA with 2:1 risk to reward ratio.
What it means
NBIS price reclaims $180 and technical indicators, suggesting a potential bullish trend reversal.