From TradingView · · 50s
NVDA Rebound or Bull Trap?
NVIDIA's price test near $215 could signal a rebound or another sell-off.
In brief
NVIDIA's price test near $215 could signal a rebound or another sell-off. NVIDIA faces a critical test at $215 to determine if it's a rebound or bull trap for the week. Originally reported by TradingView.
NVDA Approaching Key Test
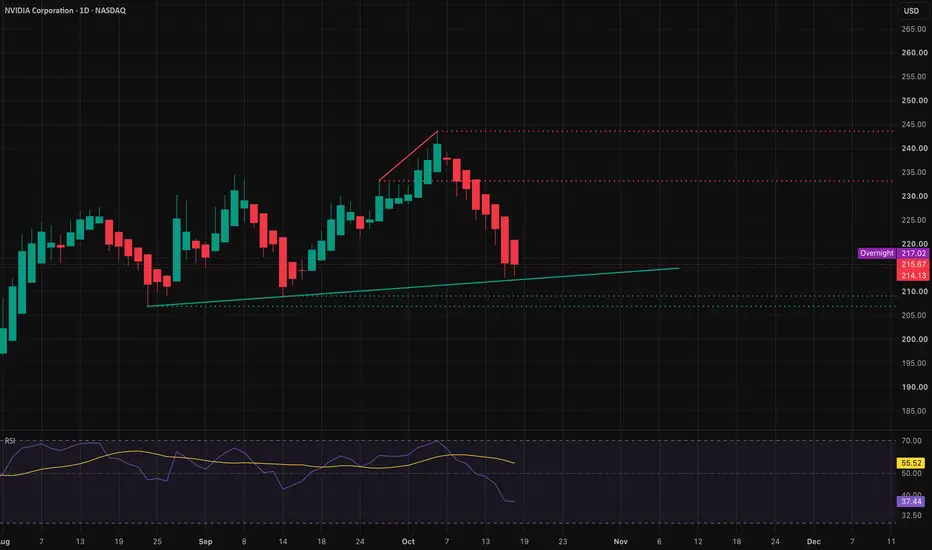
NVDA is near $215 after retreating from October high near $243.37.
Daily Chart Shows Weak Momentum
RSI has fallen to 37.4 and sits below its declining signal average.
First Support at $213.32, $212.50

Holding $213.32, $212.50 preserves the possibility of a higher low.
15-Minute Chart Shows Recovery Attempt
Price pushed above $215 with SMI accelerating above its upper threshold.
Key Resistance Levels at $218.68, $219.47
Clearing $218.68, $219.47 would bring $220, $220.40 into focus.
Critical Test for Weekly Trend
Holding $220 before the week ends could signal a rebound or bull trap.
At a glance
NVIDIA faces a critical test at $215 to determine if it's a rebound or bull trap for the week.