From TradingView · · 30s
ONG/USDT Trading Pattern
ONG/USDT consolidating inside symmetrical triangle on 4H chart.
In brief
ONG/USDT consolidating inside symmetrical triangle on 4H chart. ONG/USDT price is consolidating inside a symmetrical triangle with potential breakout above $0.087, $0.089. Originally reported by TradingView.
ONG/USDT Chart Pattern
ONG/USDT is consolidating inside a large symmetrical triangle on the 4H chart.
Current Price Range
Price is currently around $0.0848, trading inside the structure.
Breakout Potential
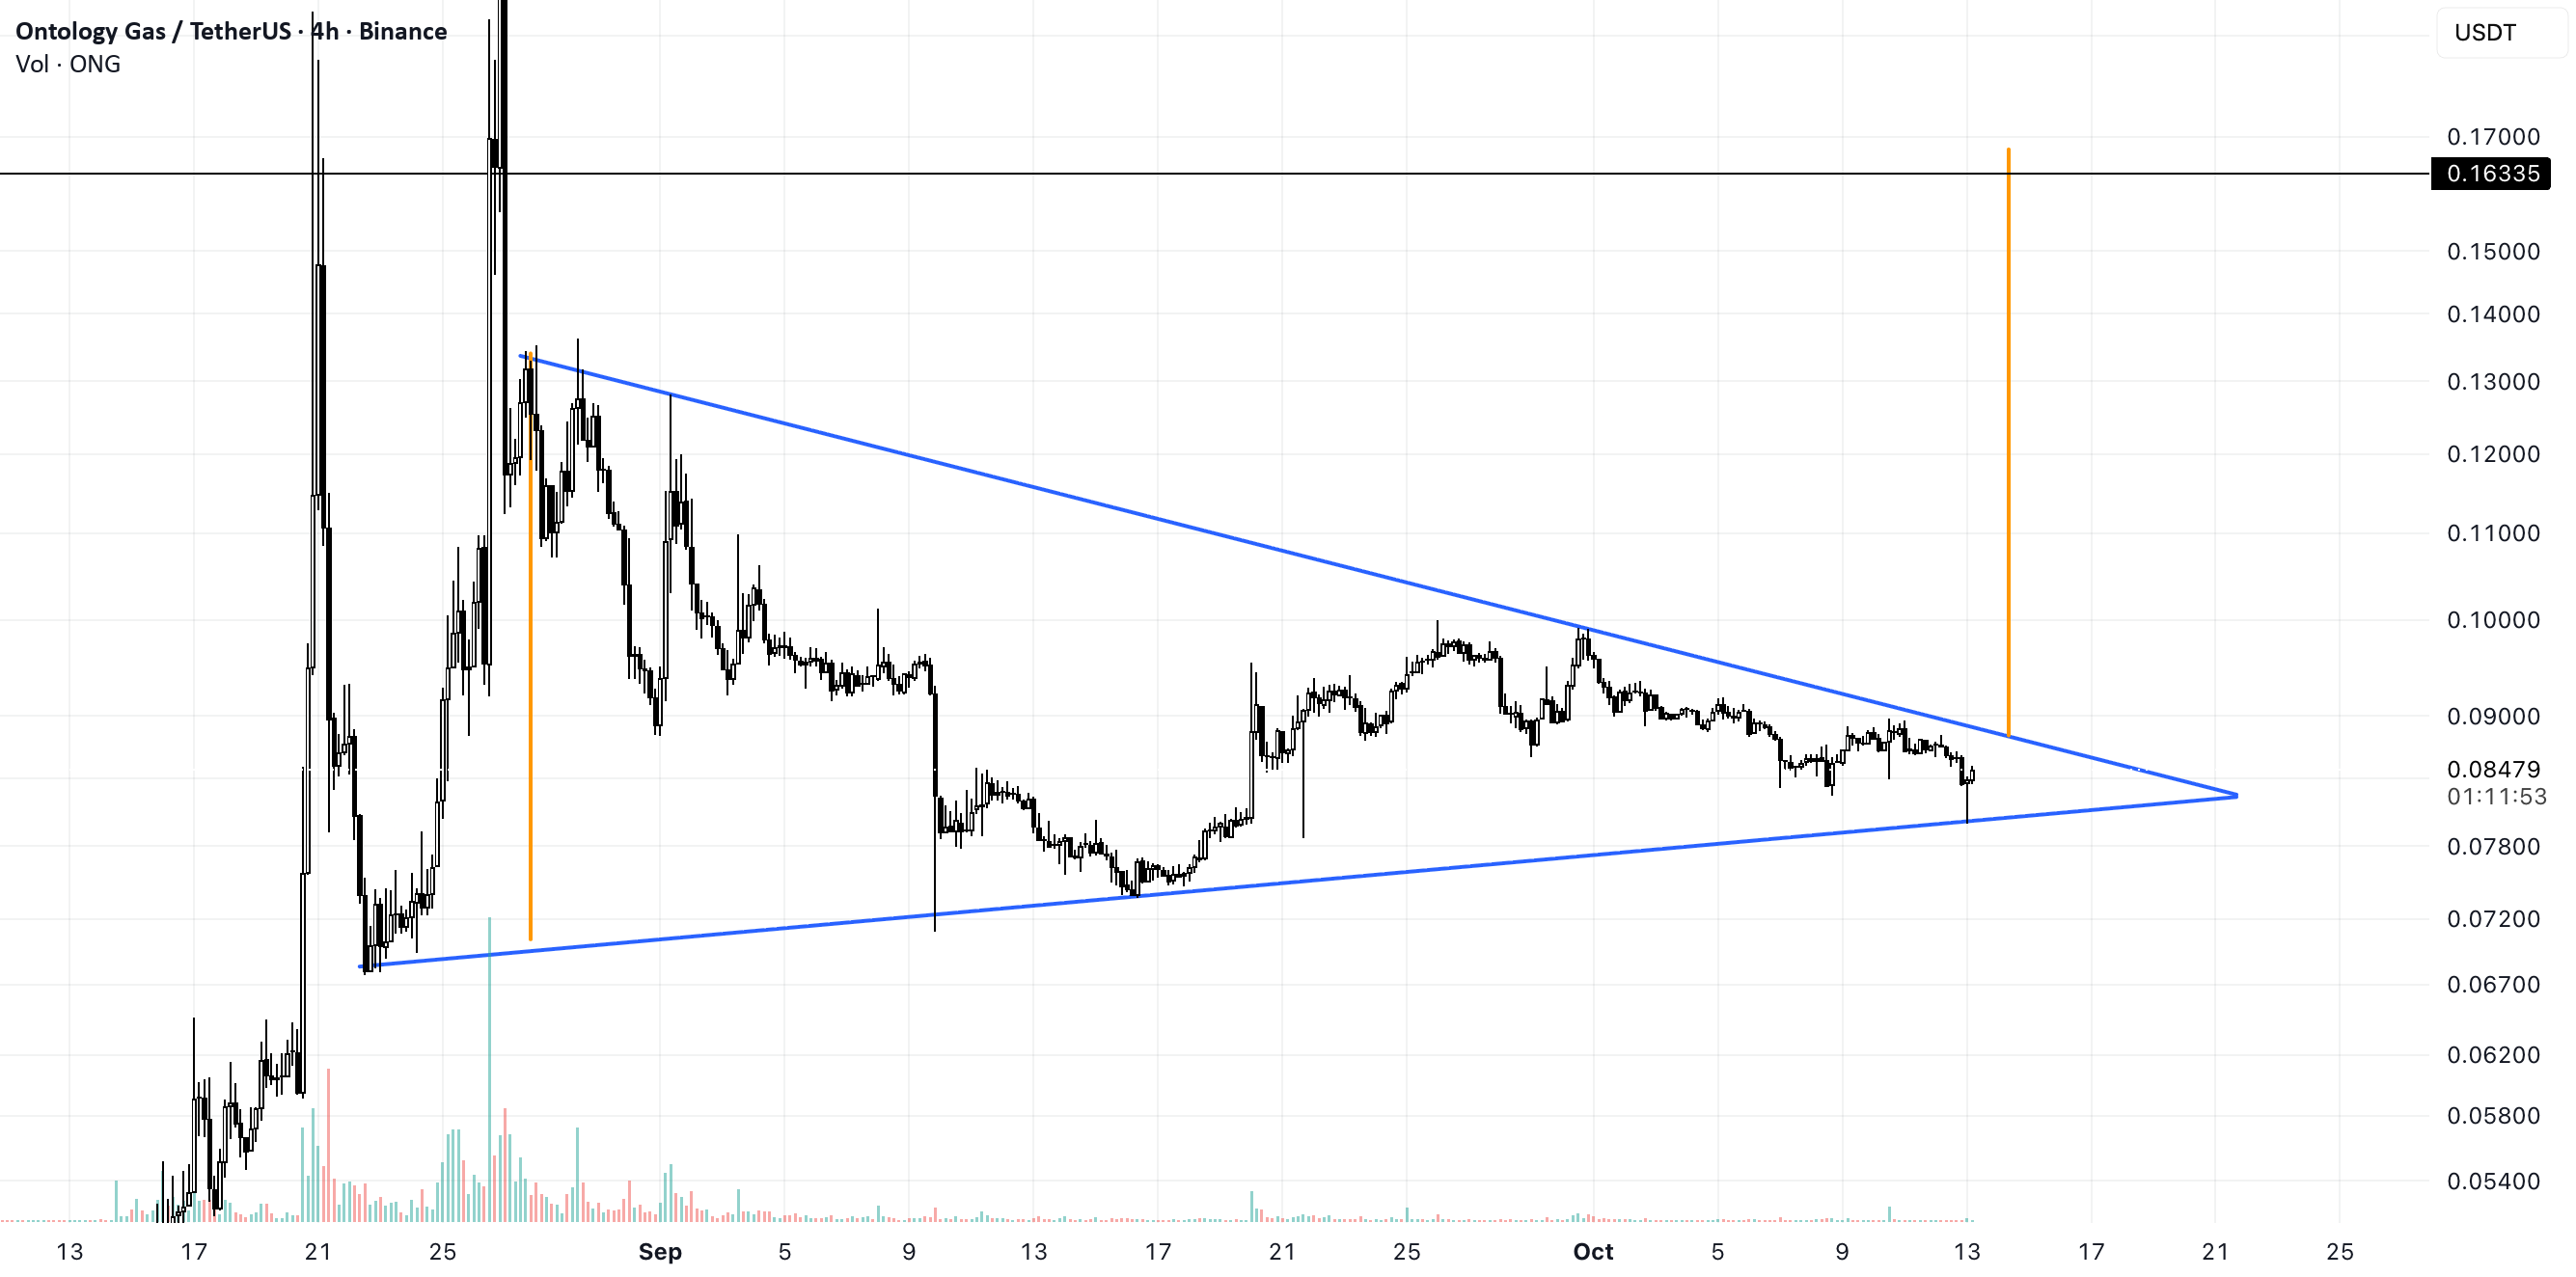
A confirmed 4H breakout above $0.087, $0.089 could validate bullish setup toward $0.163 target.
The big picture
ONG/USDT price is consolidating inside a symmetrical triangle with potential breakout above $0.087, $0.089.


