From TradingView · · 40s
PLATIND channel breakout back at line
PLATIND's daily chart shows a channel breakout pattern with recent price action near the breakout line.
In brief
PLATIND's daily chart shows a channel breakout pattern with recent price action near the breakout line. PLATIND's price has returned to the breakout line after a previous successful breakout on the daily chart. Originally reported by TradingView.
Channel breakout pattern
PLATIND's daily chart shows a channel breakout pattern with recent price action near the breakout line.
Breakout timeline
The pattern runs from 28 Jul 2026 to 8 Oct 2026 with the finder detecting it on 19 Oct 2026.
Recent price action
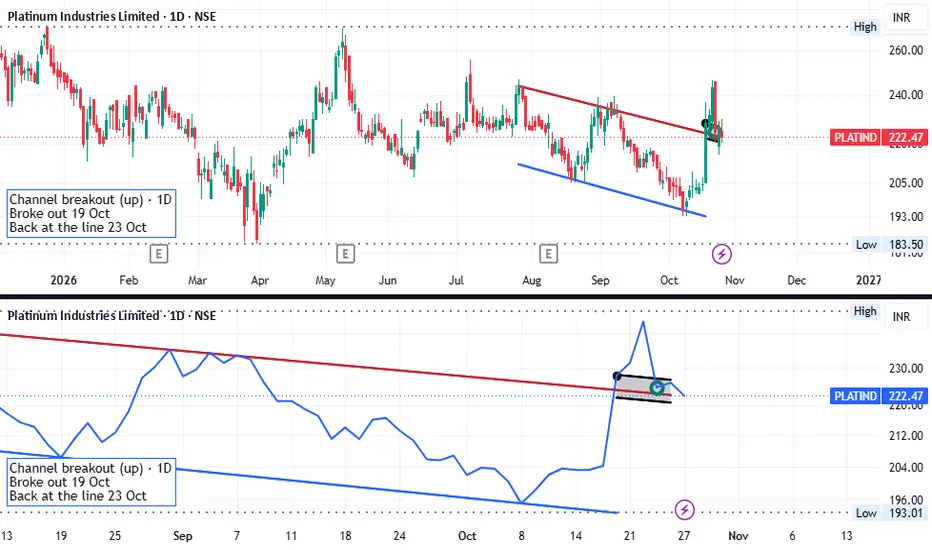
A daily close above the breakout line on 19 Oct 2026 followed by a return to the line on 23 Oct 2026.
The big picture
PLATIND's price has returned to the breakout line after a previous successful breakout on the daily chart.