From TradingView · · 1m
Rollins margin test
Rollins faces margin pressure as daily chart confirms Q3 earnings date.
In brief
Rollins faces margin pressure as daily chart confirms Q3 earnings date. Rollins reported 7.9% revenue growth but 110 basis points lower operating margin in Q2, with Q3 results scheduled for October 21. Originally reported by TradingView.
Rollins Q2 results
Rollins grew second-quarter revenue 7.9% but its GAAP operating margin fell 110 basis points.
Q2 financial figures
Revenue was $1,078.576 million versus $999.527 million. GAAP operating income increased 1.5% to $201.359 million.
Operating margin trend
Operating margin dropped from 19.8% to 18.7% with 5.7% organic revenue growth reported.
Cash flow comparison
Operating cash flow fell from $175.122 million to $172.506 million despite revenue growth.
Q3 earnings date
Rollins schedules Q3 results for October 21 after market close with earnings call on October 22.
Daily chart analysis
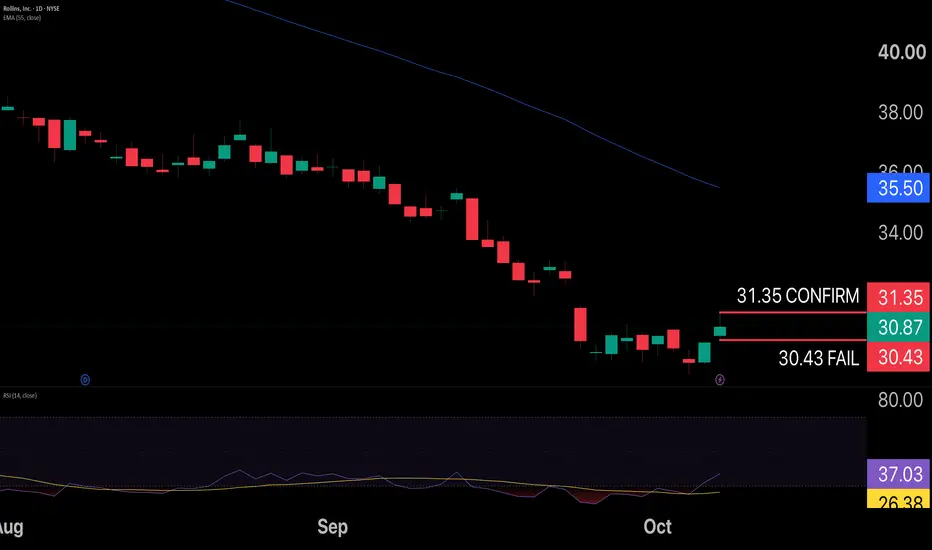
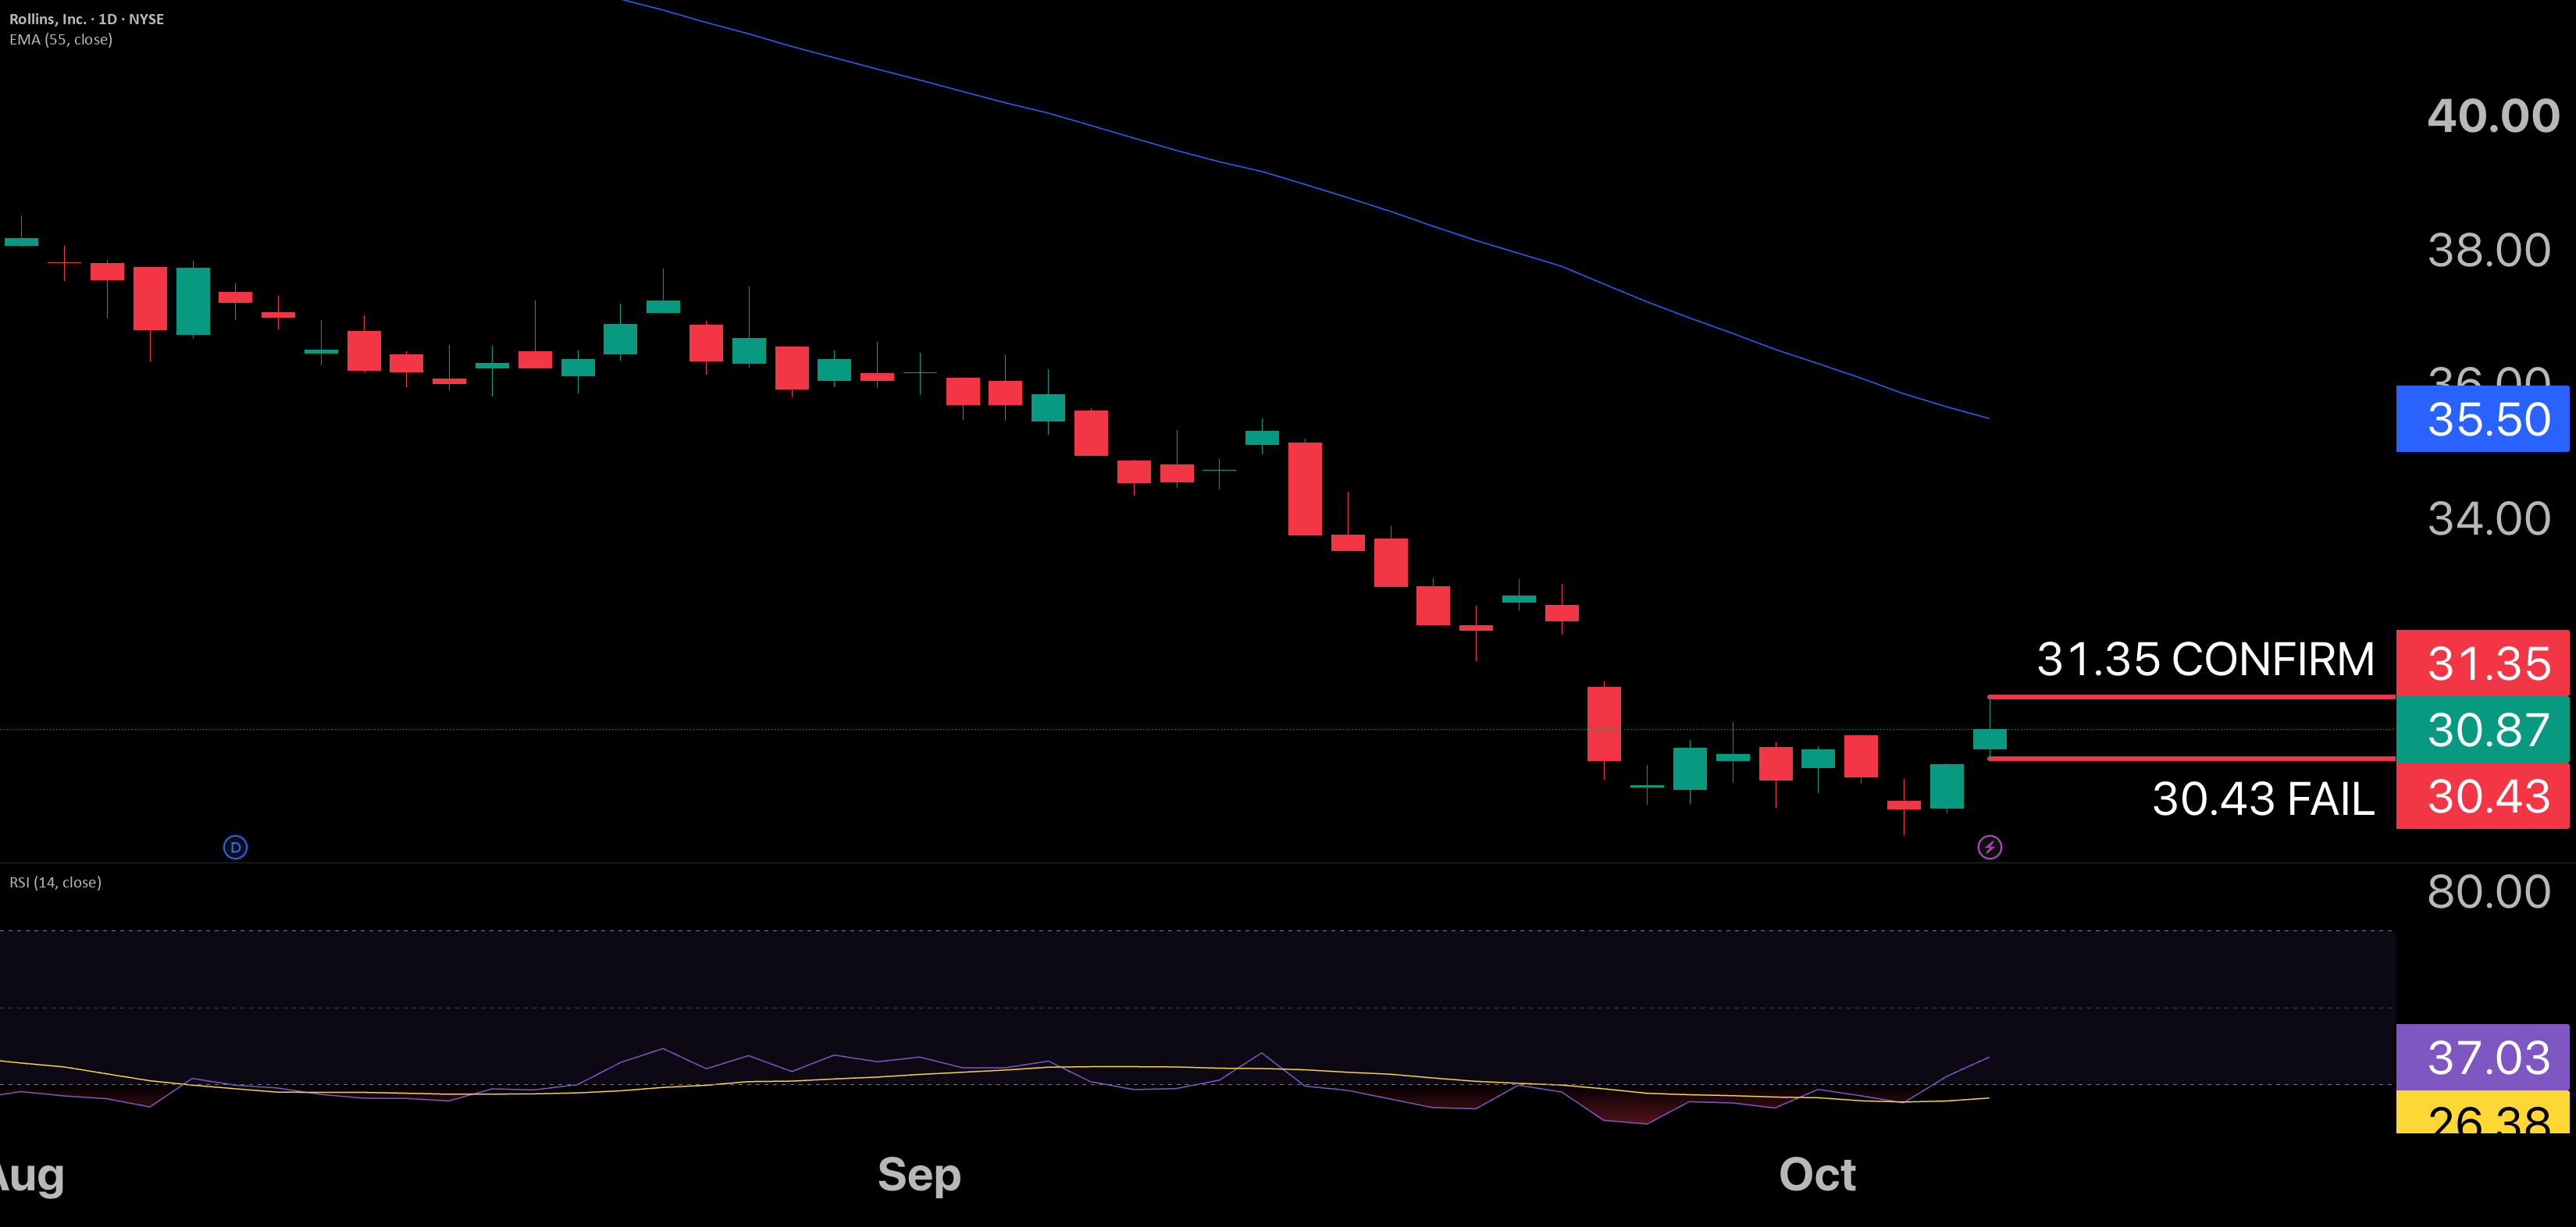
The chart shows a daily bar closing at 30.87 with EMA55 at 35.50 and RSI14 at 37.03.
Conditional paths
A close above 31.35 would improve near-term repair case; below 30.43 would weaken the rebound.
The essence
Rollins reported 7.9% revenue growth but 110 basis points lower operating margin in Q2, with Q3 results scheduled for October 21.