From TradingView · · 1m 10s
Silver 2H | Similar Uncertainty, Different Wave Structure
Silver's price action shows two possible paths: a completed correction or ongoing bearish trend.
In brief
Silver's price action shows two possible paths: a completed correction or ongoing bearish trend. Silver may complete a correction or continue a bearish trend based on price action. Originally reported by TradingView.
Silver 2H Chart Analysis
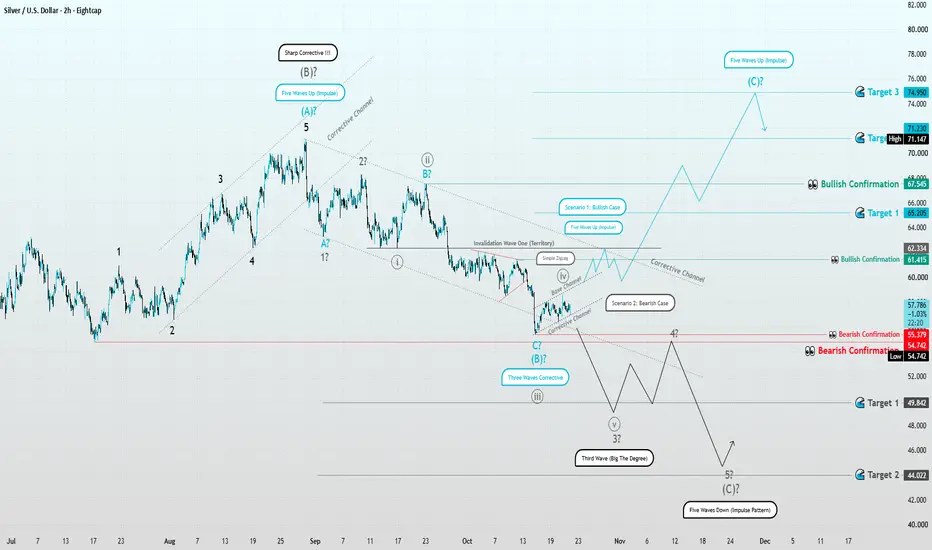
Silver price action shows two possible market structures on the 2-hour chart.
Scenario 1: Potentially Completed Correction
A simple zigzag may complete the recent decline, with 61.415 as the first important level for bullish strength.
Scenario 1: Bullish Reversal

A sustained break above 67.545 could confirm a bullish reversal with reference levels at 65.205, 71.230, and 74.950.
Scenario 2: Bearish Structure Continues
The recent recovery may be temporary, with 55.379 and 54.742 as key reference points for bearish continuation.
Scenario 2: Further Downside
A valid break below 49.842 could signal further downside, with 44.022 as a potential reference level.
Why Analyze Silver Independently
Silver can move more aggressively than gold, with different wave structures despite similar market factors.
Current Market Status
Both scenarios remain open until price action provides stronger structural confirmation in either direction.
What to remember
Silver may complete a correction or continue a bearish trend based on price action.