From TradingView · · 1m 10s
Six years of Fed decisions mapped against gold prices
A visual guide to every FOMC rate move from 2020 through mid-2026 and how gold responded.
In brief
A visual guide to every FOMC rate move from 2020 through mid-2026 and how gold responded. Gold's price movements closely track Federal Reserve rate decisions, with cuts typically supporting higher prices. Originally reported by TradingView.
Tracking 54 Fed meetings
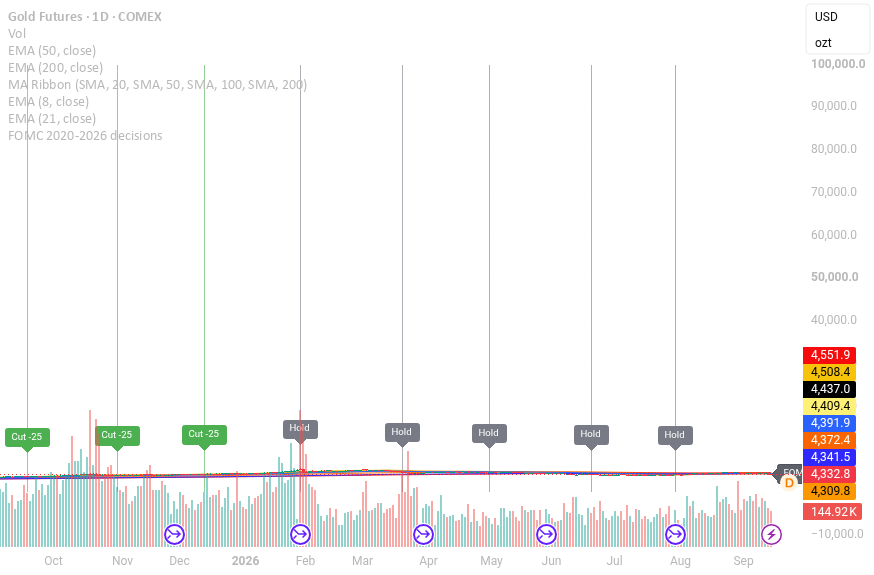
A chart marks every FOMC rate decision from January 2020 through July 2026. Red bubbles show hikes, green shows cuts, gray shows holds.
Gold mapped with key indicators
The chart plots gold futures alongside the dollar index and Treasury yields. These three indicators together show the full context of Fed policy impact.
Last hike was July 2023
The Federal Reserve's final rate increase in the tightening cycle came on July 26, 2023. This marked the peak of the hiking campaign.
“Last hike Jul 26 2023”
First cut arrived September 2024
The easing cycle began on September 18, 2024. This was the first rate reduction after more than a year of holding at peak levels.
“first cut of easing cycle Sep 18 2024”
Rates frozen through mid-2026
The Fed is projected to hold rates at 3.50 to 3.75 percent through July 2026. No further cuts or hikes are expected in this window.
“Holds at 3.50, 3.75% through Jul 2026”
What matters most
Gold's price movements closely track Federal Reserve rate decisions, with cuts typically supporting higher prices.