From TradingView · · 40s
SOLUSDT Liquidity Zone Before Expansion
SOLUSDT price hits key support after rebounding from 92.00.
In brief
SOLUSDT price hits key support after rebounding from 92.00. SOLUSDT price reached target levels after rebounding from 92.00 support zone. Originally reported by TradingView.
Liquidity Zone Analysis
SOLUSDT price moves within bearish channel on 1-hour chart.
Support Levels
Price reached lower boundary with initial support at 94.00 and key support at 92.00.
Technical Indicators
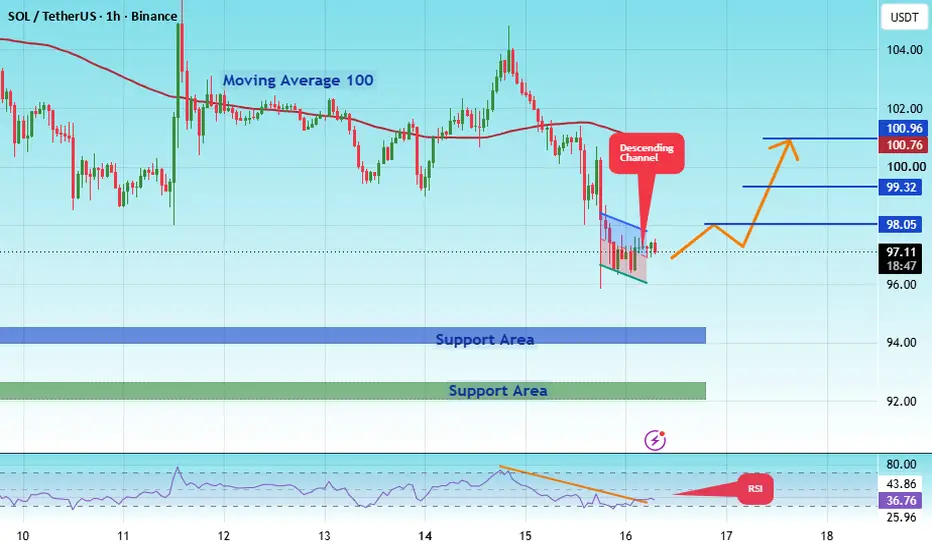
RSI shows bearish trend but potential upward breakout due to oversold conditions.
Price Targets
Entry price 97.00 with targets at 98.05, 99.32, and 100.96.
Trade Outcome
Trade closed with all targets reached on Sep 18.
In short
SOLUSDT price reached target levels after rebounding from 92.00 support zone.