From TradingView · · 50s
SOLV Could See Major Recovery
SOLV price may rebound if it breaks key resistance on TradingView chart.
In brief
SOLV price may rebound if it breaks key resistance on TradingView chart. SOLV could recover to 0.01977 USDT if it breaks descending trendline resistance. Originally reported by TradingView.
SOLV Trading Action
SOLV/USDT trades within long-term bearish structure with descending trendline resistance.
Key Resistance Level
Descending trendline acts as critical resistance at 0.00553 USDT for potential recovery.
Bullish Scenario
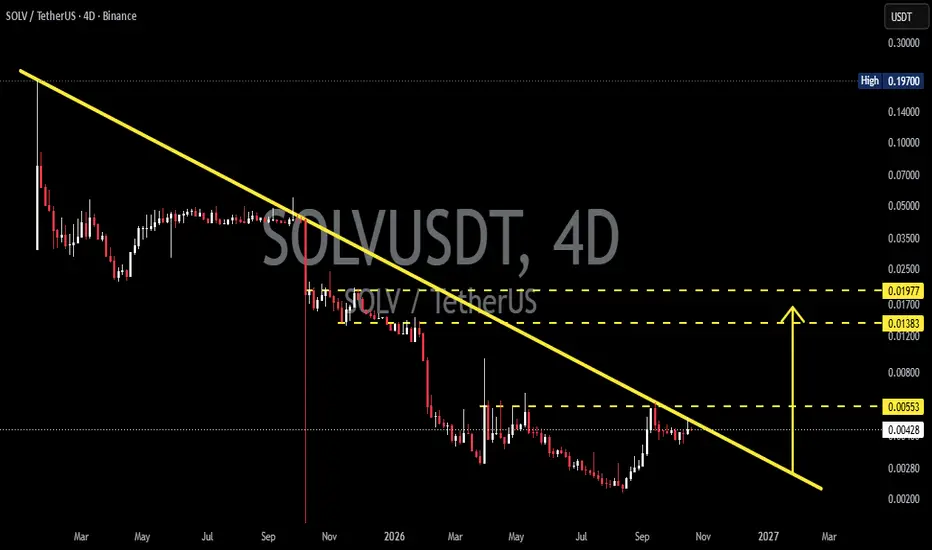
Break above trendline could signal recovery targeting 0.01383 USDT and 0.01977 USDT.
Bullish Targets
Initial recovery target at 0.00553 USDT followed by 0.01383 USDT and 0.01977 USDT.
Bearish Scenario
Failure to break trendline may lead to price revisiting recent swing lows.
Critical Levels
0.00553 USDT: first resistance, 0.01383 USDT: intermediate resistance, 0.01977 USDT: major target.
Trading Perspective
Bullish confirmation requires breakout above trendline with volume support.
The main idea
SOLV could recover to 0.01977 USDT if it breaks descending trendline resistance.