From TradingView · · 1m
S&P 500's worst week median -4.6% since 1988
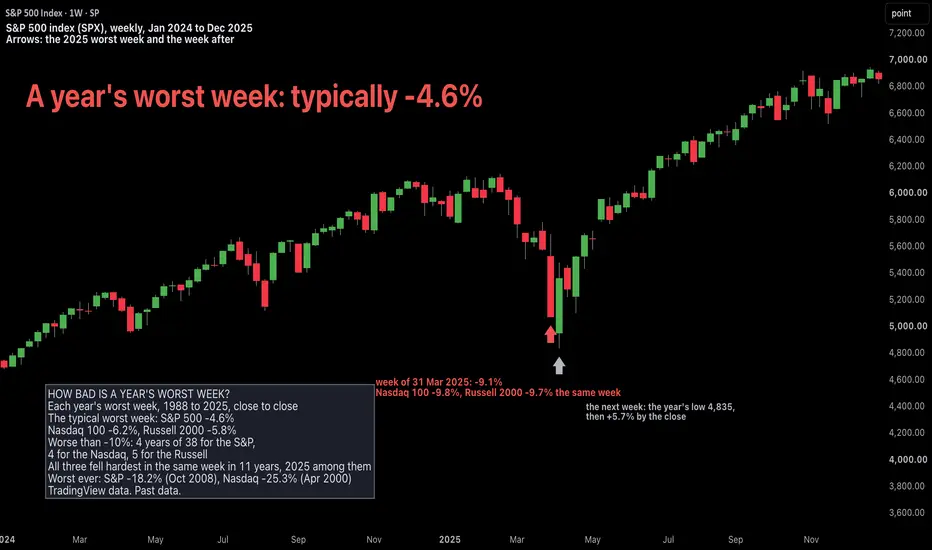
S&P 500's worst week costs median -4.6% since 1988.
In brief
S&P 500's worst week costs median -4.6% since 1988. The S&P 500's worst week averages -4.6% since 1988, with Nasdaq 100 at -6.2% and Russell 2000 at -5.8%. Originally reported by TradingView.
S&P 500 worst week
The S&P 500's worst week costs about 4.6% since 1988.
Nasdaq 100 worst week
The Nasdaq 100's worst week costs 6.2% since 1988.
Russell 2000 worst week
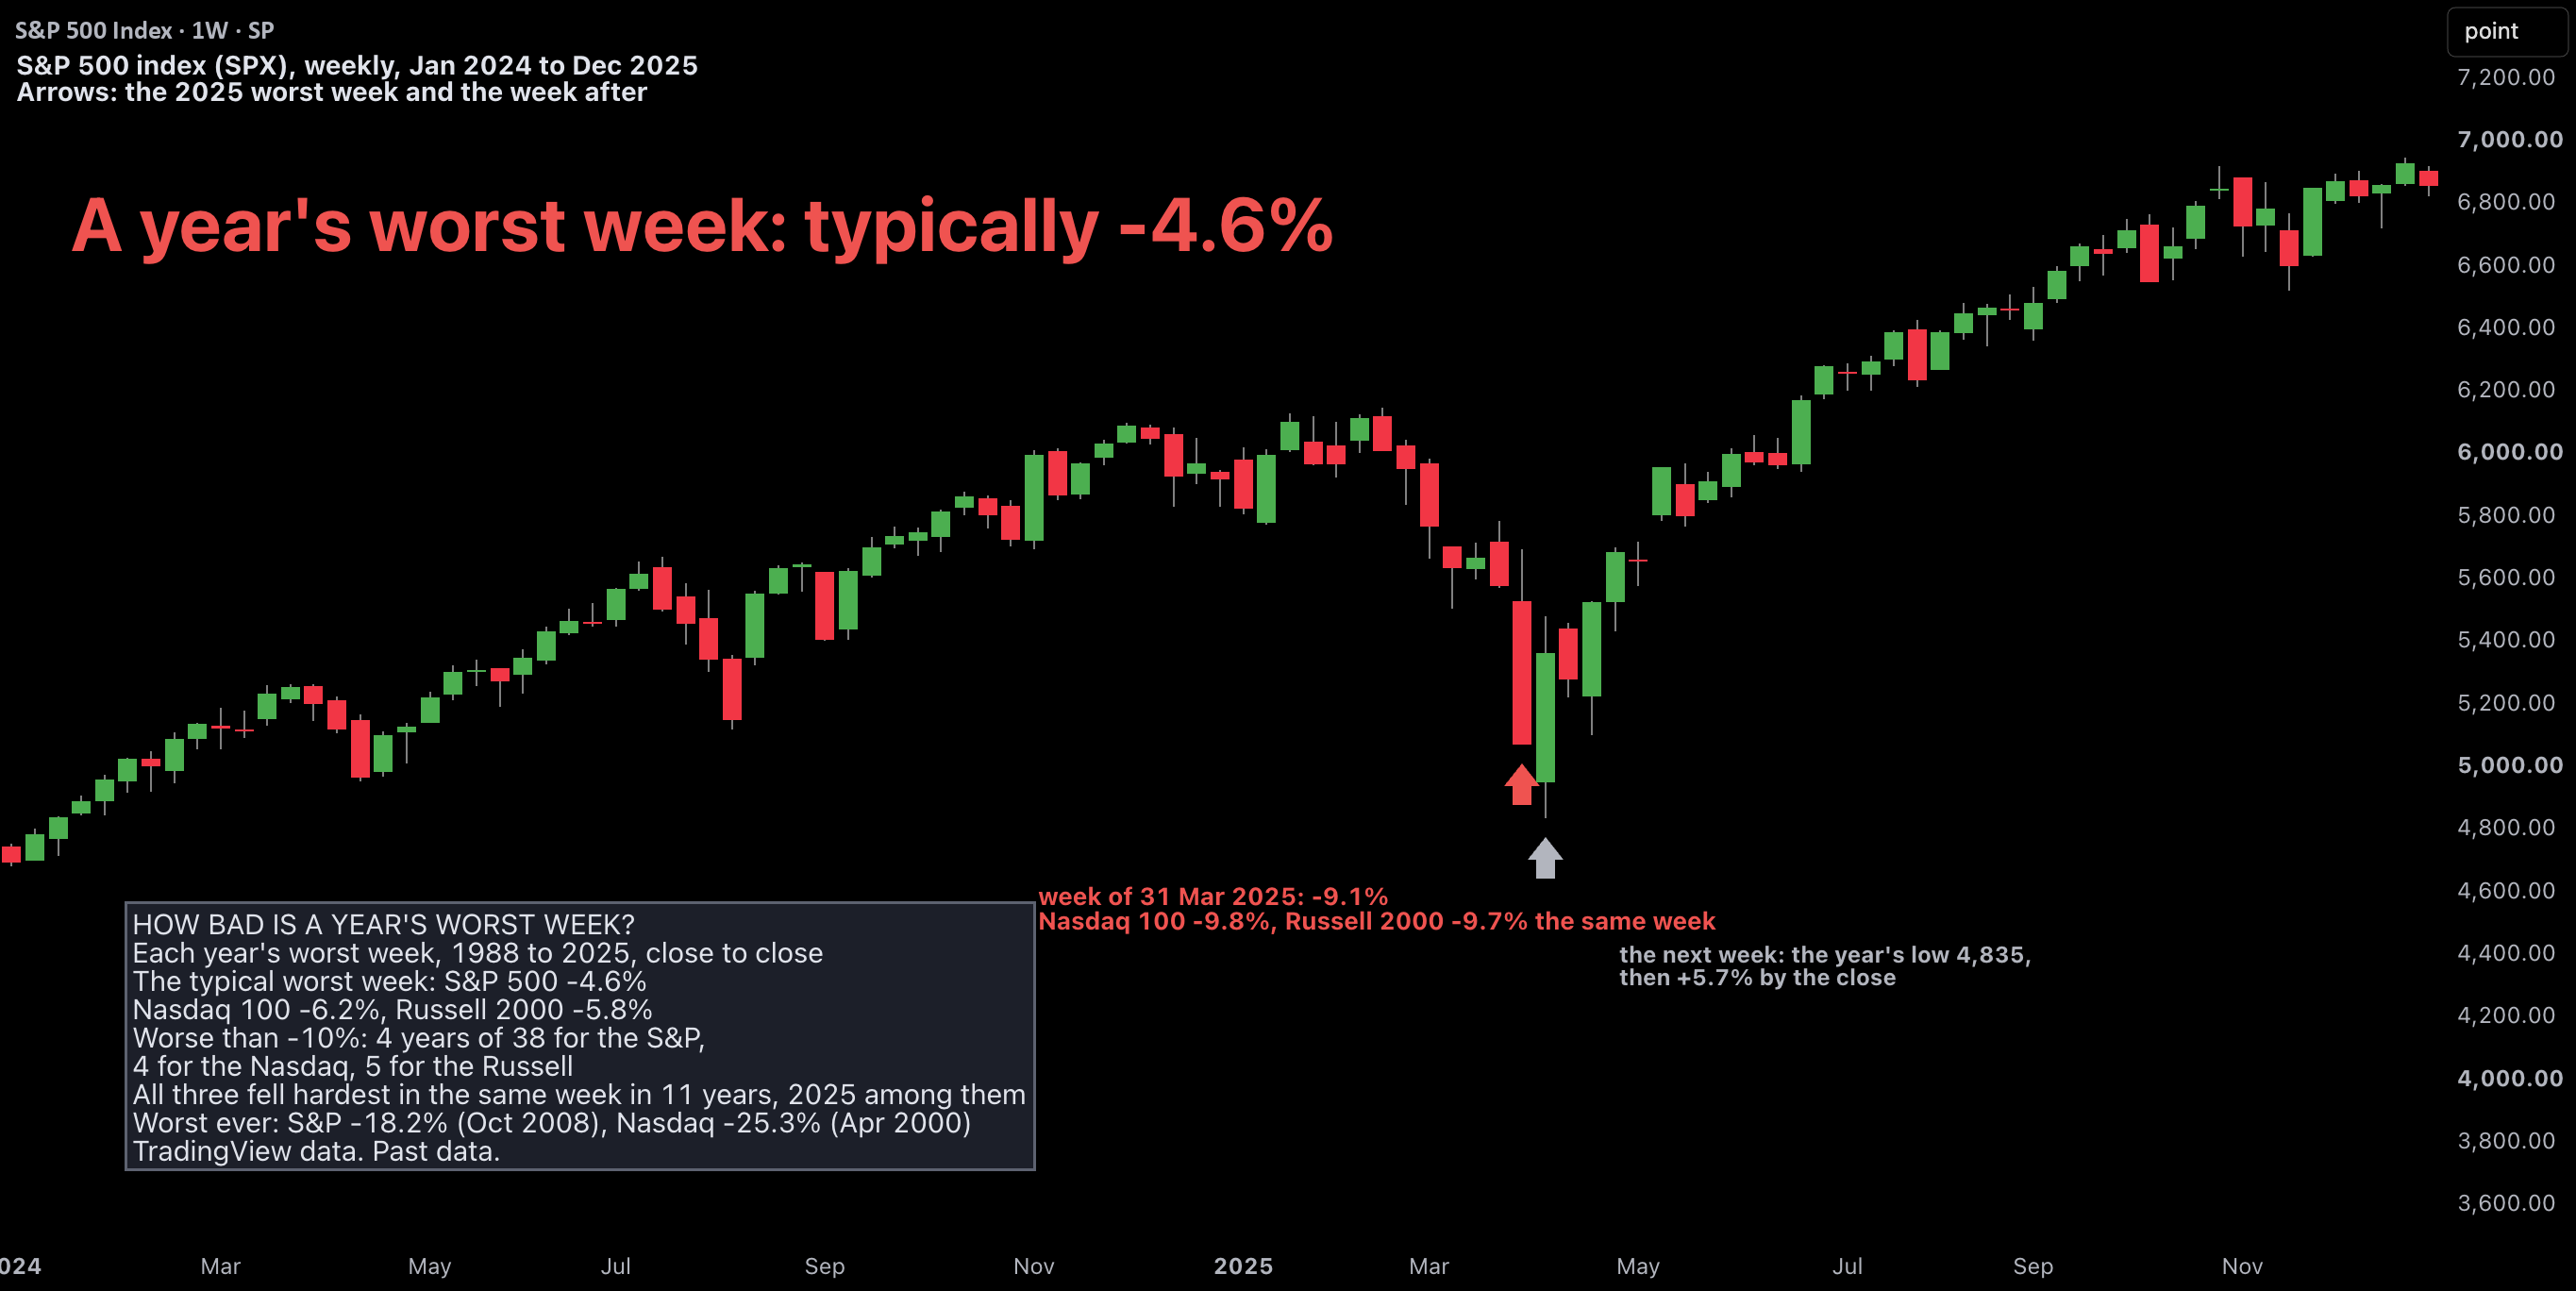
The Russell 2000's worst week costs 5.8% since 1988.
Worst weeks ever
The S&P 500 dropped 18.2% in October 2008, Nasdaq 100 25.3% in April 2000, Russell 2000 16.5% in March 2020.
Same week worst weeks
All three indices had their worst week in the same week 11 times since 1988.
Recent years
2022: S&P 500 -5.8%, Nasdaq 100 -7.5%, Russell 2000 -8.1%; 2023: -4.5%, -3.7%, -8.1% in SVB collapse week.
In short
The S&P 500's worst week averages -4.6% since 1988, with Nasdaq 100 at -6.2% and Russell 2000 at -5.8%.