From TradingView · · 1m 20s
The ETH short setup hiding above $2,800
A trader maps why Ethereum's climb toward $3,000 could be the setup for a drop back to $1,508.
In brief
A trader maps why Ethereum's climb toward $3,000 could be the setup for a drop back to $1,508. The rally into $2,800 to $3,020 is the thing to watch. Rejection there is the signal, not the rally itself. Originally reported by TradingView.
Ethereum at $2,520

ETH sits near 2,520 after climbing hard off the June lows. The bounce has already carried price into territory the analyst flagged in advance.
“Ethereum is currently trading around 2,520 after a strong recovery from the June lows.”
Into the liquidity zone
Price has now tagged the $2,400 to $2,500 band that was marked earlier as a liquidity area. More liquidity still sits above the recent highs.
The ceiling is $2,780
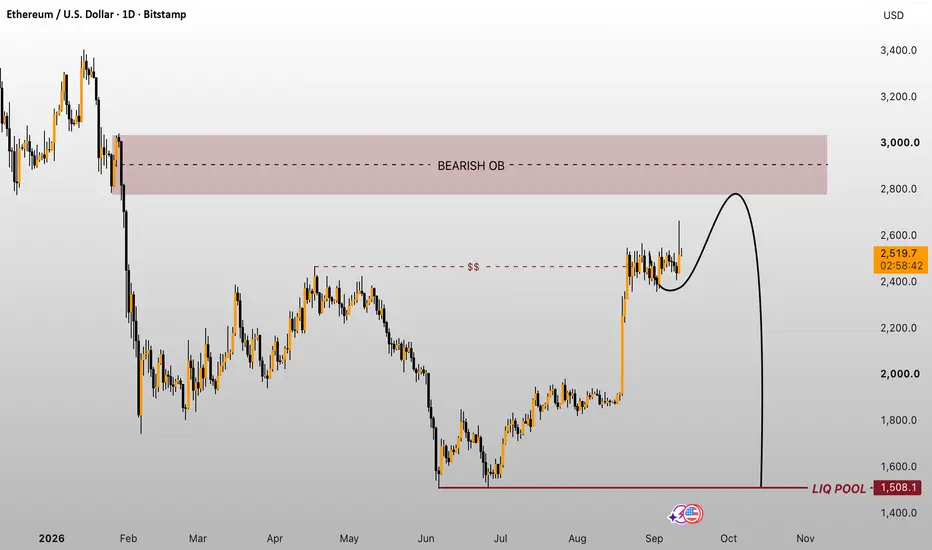
A daily bearish order block spans roughly $2,780 to $3,020. That block is the major resistance, and it has not been touched yet.
“The major resistance is the Daily Bearish Order Block around $2,780, $3,020.”
Higher first, then lower
The projected path is a continuation up into that block. Price mitigates the supply zone before any larger bearish reaction begins.
Rejection is the trigger
Nothing happens on arrival alone. The setup needs clear rejection out of $2,800 to $3,020 before the short thesis is live.
“If price reaches the $2,800, $3,020 supply zone and shows clear rejection”
Target: $1,508
The downside objective is the $1,508 liquidity pool marked on the chart. Until the supply zone is reached, watch the recent highs for confirmation.
“the downside could target the $1,508 liquidity pool marked on the chart”
What to remember
The rally into $2,800 to $3,020 is the thing to watch. Rejection there is the signal, not the rally itself.