From TradingView · · 1m 30s
The Nasdaq fib line that decides everything
One chart level has bookended every panic since 2018, and the index is sitting right on the next one.
In brief
One chart level has bookended every panic since 2018, and the index is sitting right on the next one. The 6.8 fib extension is the line that matters: hold it and the bull run continues, lose it and a 40% drop is the floor of the damage. Originally reported by TradingView.
One fib, drawn from the crash
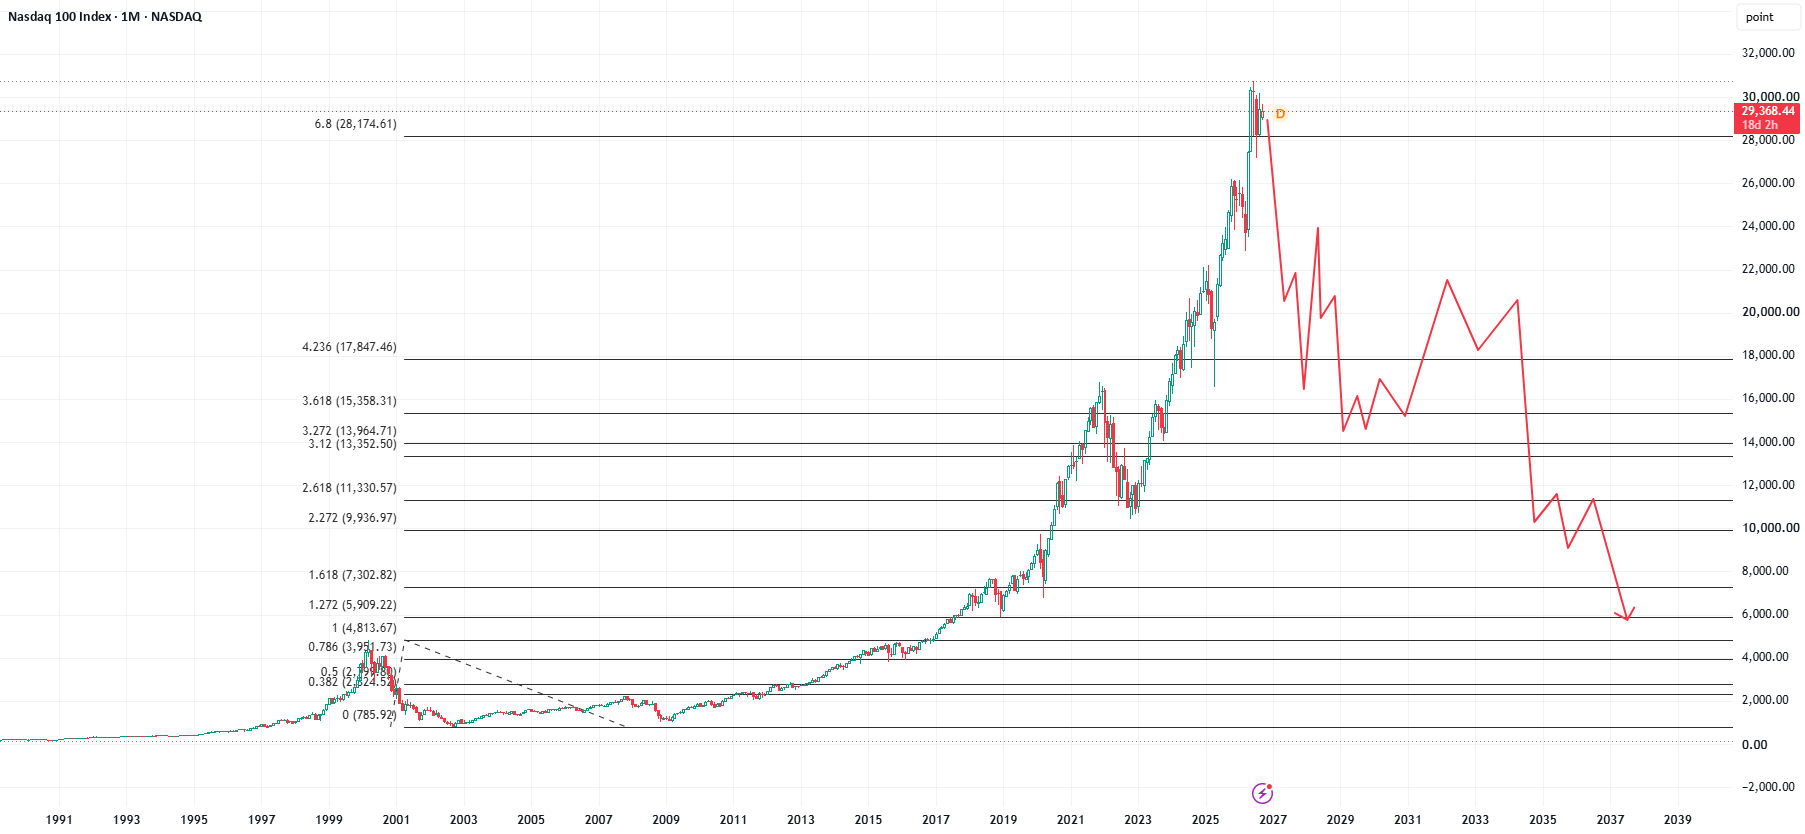
Take a fibonacci from the high to the low of the 2000 Nasdaq crash. Every level it produces has quietly shaped the last decade of the index.
Every panic landed on a level
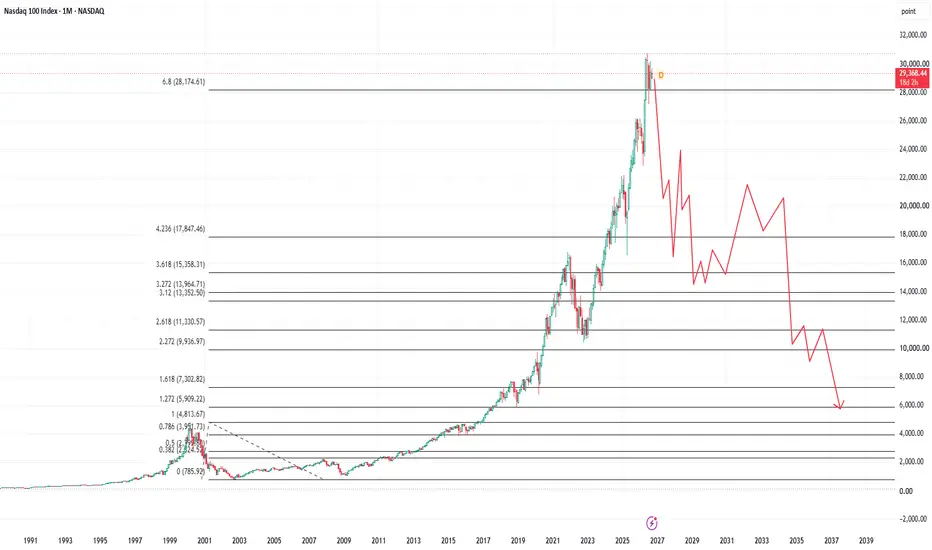
The 2018 vol panic traded 1.61 to 1.27. Covid in 2020 ran 2.20 to 1.61. The 2022 inflation panic covered 3.60 to 2.61, and 2025's war scare sharply retested 4.23.
“these fibs have bookended almost every major event in the last decade”
Now sitting at 6.8
The index has arrived at the 6.8 extension. This is not another waypoint, it is where the trend picks a direction.
“Now we are at the 6.8, which is a critical trend decision”
Break it and it's ugly
If 6.8 fails as support, the floor is a 40% decline. If the supports below that go too, the damage runs well past it.
“we can see minimum of a 40% drop and significantly more if next supports break”
Hold it and it rips
If 6.8 holds, or price fakes out below and reclaims it, the setup flips. The likely outcome is an exceptional move higher.
A range nobody has seen
This is the 6.8 extension of an 80% index collapse, and price has ranged here for nearly six months. The only comparable was the 29 extension that marked the 1987 top.
“This is the first time that's happened in your lifetime.”
The bottom line
The 6.8 fib extension is the line that matters: hold it and the bull run continues, lose it and a 40% drop is the floor of the damage.