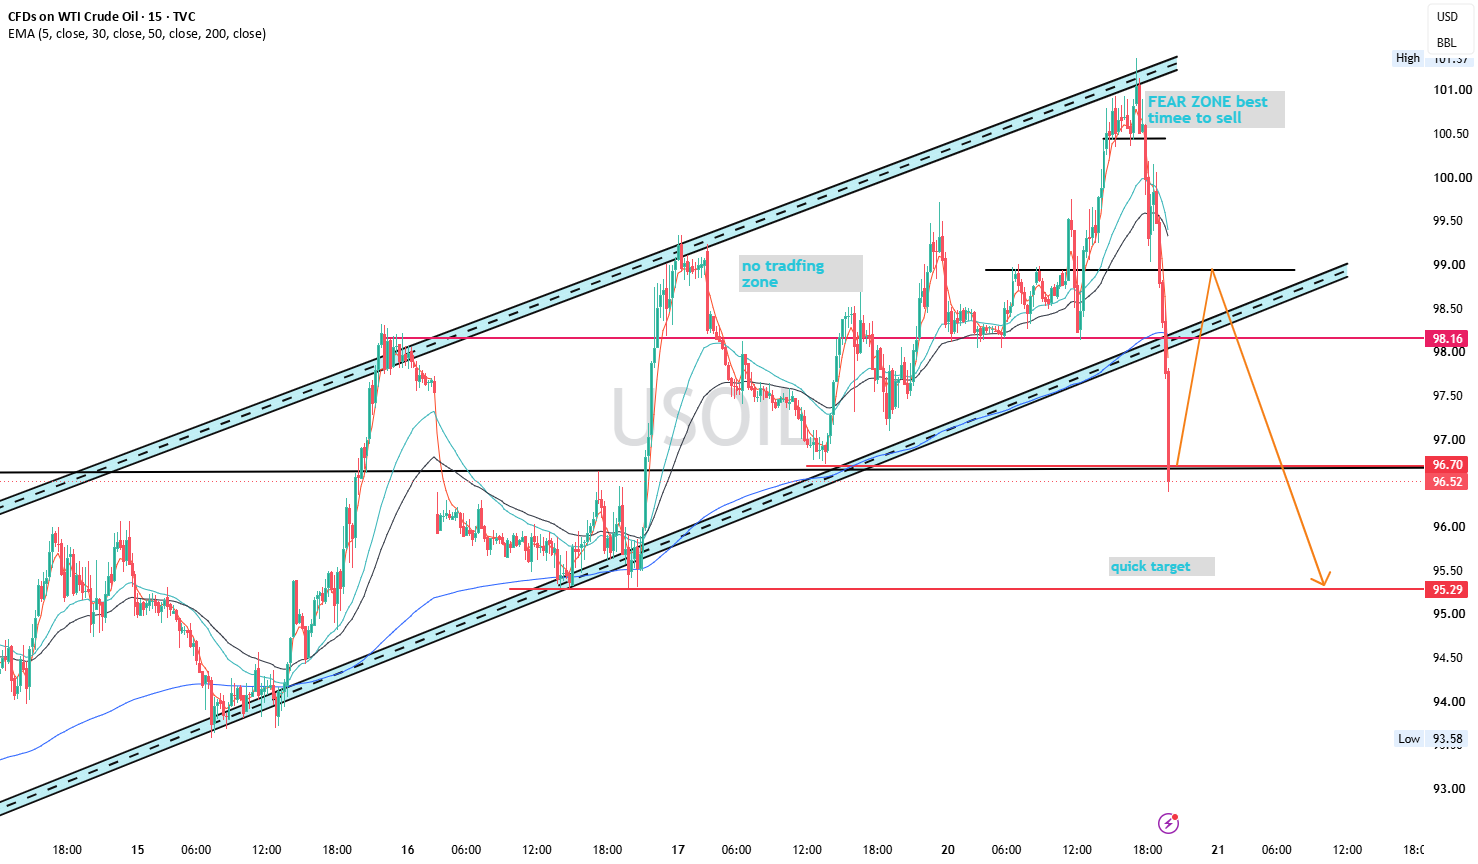
From TradingView · · 30s
Triangle Patterns in Technical Analysis for NASDAQ:XRPN
TradingView chart shows NASDAQ:XRPN following ascending triangle pattern.
In brief
TradingView chart shows NASDAQ:XRPN following ascending triangle pattern. NASDAQ:XRPN price moves in ascending triangle pattern with resistance levels. Originally reported by TradingView.
Ascending Triangle Pattern
The ascending triangle pattern forms as a security’s price bounces back and forth between two lines.
Price Movement and Resistance
Prices move to a high, meet resistance, and drop as securities are sold.
Resistance Pattern Behavior

Each sell-off after meeting resistance stops at a higher level than the previous attempt.
At a glance
NASDAQ:XRPN price moves in ascending triangle pattern with resistance levels.