From TradingView · · 1m
UFPI Daily Reclaims 79.530 Before Falling 55 EMA
UFPI closes above 79.530 but remains below falling 55 EMA.
In brief
UFPI closes above 79.530 but remains below falling 55 EMA. UFPI reclaimed 79.530 but failed to break 55 EMA, signaling potential short-term correction. Originally reported by TradingView.
Daily Close Analysis
UFPI daily candle closed above 79.530 but remains unfinished.
Current Price Range
Traded from 78.490 open to 79.740 intraday high with low of 78.315.
Fibonacci Levels

Recent Fibonacci map uses October 6 high of 79.530 and October 12 low of 73.720.
55 EMA Context
Daily chart remains below falling 55 EMA at 81.331.
RSI Status
RSI recovered to 51.93 above midpoint but does not confirm breakout.
Recovery Requirements
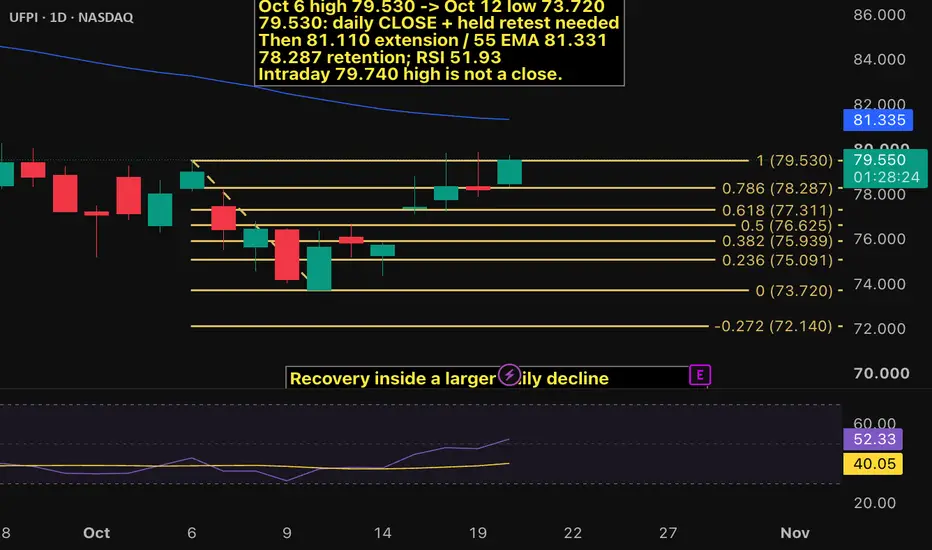
Requires completed daily close above 79.530 and retention of 78.287.
October 24 Update
UFPI closed at $81.230 after trading from $80.970 to $83.085.
Updated Fibonacci Levels
Calculated references at 23.6%: $81.551, 38.2%: $80.054, 50%: $78.845.
The essence
UFPI reclaimed 79.530 but failed to break 55 EMA, signaling potential short-term correction.


